-
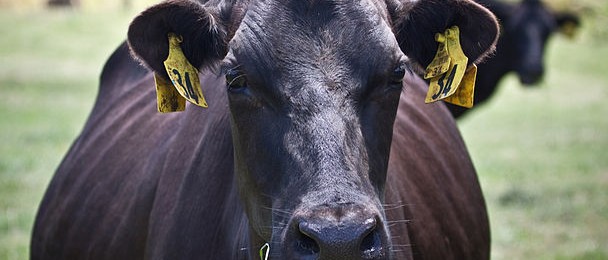
One area of hot research in reducing carbon emissions is work on reducing the emission of methane from cattle digestion. While cow belches do not put as much carbon into the air as the burning of fossil fuel for transportation and energy production, it is one area in agriculture that is being studied to see…
-

This week is Hurricane Awareness week for NOAA. All week the National Weather Service will be providing information about hurricanes and tropical storm risk. In the Southeast we are particularly vulnerable to Atlantic hurricanes, and after more than ten years without a strong storm, it feels like we are overdue for one. Today’s blog post…
-

Today is the first day of the official tropical season in the Eastern Pacific Ocean. And right on time, we see a 10% chance of formation from a disorganized system of clouds. As we swing from El Niño to La Niña this summer, we are likely to see fewer than usual storms in the Eastern…
-
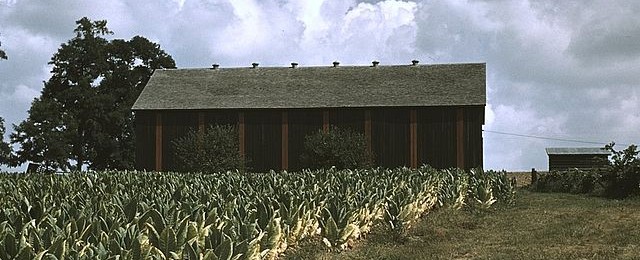
The Southeast Farm Press reported this week that a frost which hit the Tobacco Belt in mid-April caused damage to some young tobacco transplants this year. Initial concerns were for a significantly reduced crop, but most fields have recovered with little loss, it appears. The report states that “The damage seemed worse on the light/sandy…
-

In preparation for an interview next week, I am reading “The Worst Hard Time: The Untold Story of Those Who Survived the Great American Dust Bowl.” It’s a great book, and I am enjoying it. I was struck this morning by a description of the dust storms of mid-May, 1934 (82 years ago this week),…
-
While this weekend will be dry across the Southeast, starting by mid-week we should return to a wetter pattern, and we could see up to two inches of rain in some areas by Friday. A few locations could see even more. This appears to be a shift to wetter conditions overall, according to maps from…
-
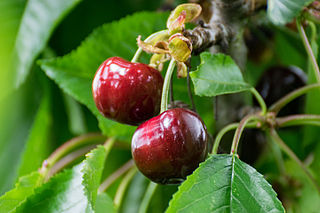
Even though California needs rain to combat the multi-year drought they’ve been experiencing, rain at the wrong time can hurt the production of fruit and other crops. The Packer noted this week that rain in California delayed the harvest of cherries in parts of the state and heavy rains and temperature fluctuations in early May…