-

Earlier this week NOAA released the latest monthly and seasonal climate outlooks for the US. They show that the current pattern of warmer and drier conditions in the southern part of the region associated with the weak La Nina we are in now is likely to continue for the next few months. This lingering effect…
Posted in: Climate outlooks -

The latest Drought Monitor, released today, shows that while rain put a dent in a band of the region stretching from Mississippi to the western mountains of North Carolina, most of the region to the south and east of that rainy area got drier this week, increasing drought overall in the region. The biggest increase…
Posted in: Drought -

The annual summary of the climate of the United States was published earlier this week by NOAA. It shows that 2025 was the fourth warmest year since US records began in 1890. Almost none of the lower 48 states was cooler than normal. You can read the summary at https://www.ncei.noaa.gov/news/national-climate-202513. In addition to temperature and…
Posted in: Climate summaries -
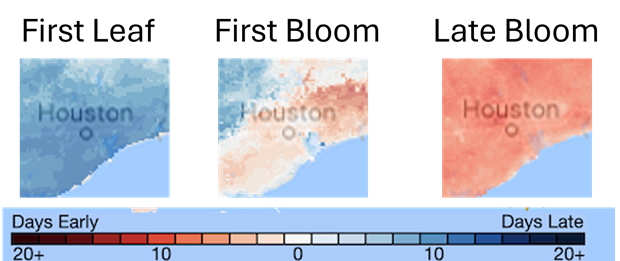
In previous years, I have discussed the use of phenology to study changes in climate that go back before instrumental records were available (because the instruments had not been invented yet). Phenology is the study of when plants exhibit biological markers associated with the change of the seasons, such as the first leaf appearance on…
-

Earlier this week, NOAA released their annual summary of global climate conditions for 2025. The observations showed that 2025 was the third warmest year on record, right behind last year (the warmest on record) and 2023, the second warmest on record. Temperatures this year were slightly cooler than in the previous two years because of…
Posted in: Climate summaries -

The latest 7-day QPF map shows little precipitation is likely to fall over the next week across most of the Southeast. This is in spite of the fact that social media-rologists have been cranking out maps showing a potential snow storm for parts of the region around January 18. Most of the trusted meteorologists I…
Posted in: Climate outlooks -

You’ve probably all seen detailed image of individual snowflakes on dark backgrounds taken by cameras attached to microscopes. The first person who made these thrilling pictures was Vermont farmer Wilson Bentley, nicknamed “Snowflake Bentley” for the thousands of photographic plates he made of individual snowflakes up in Jericho, VT. In his lifetime, he photographed over…