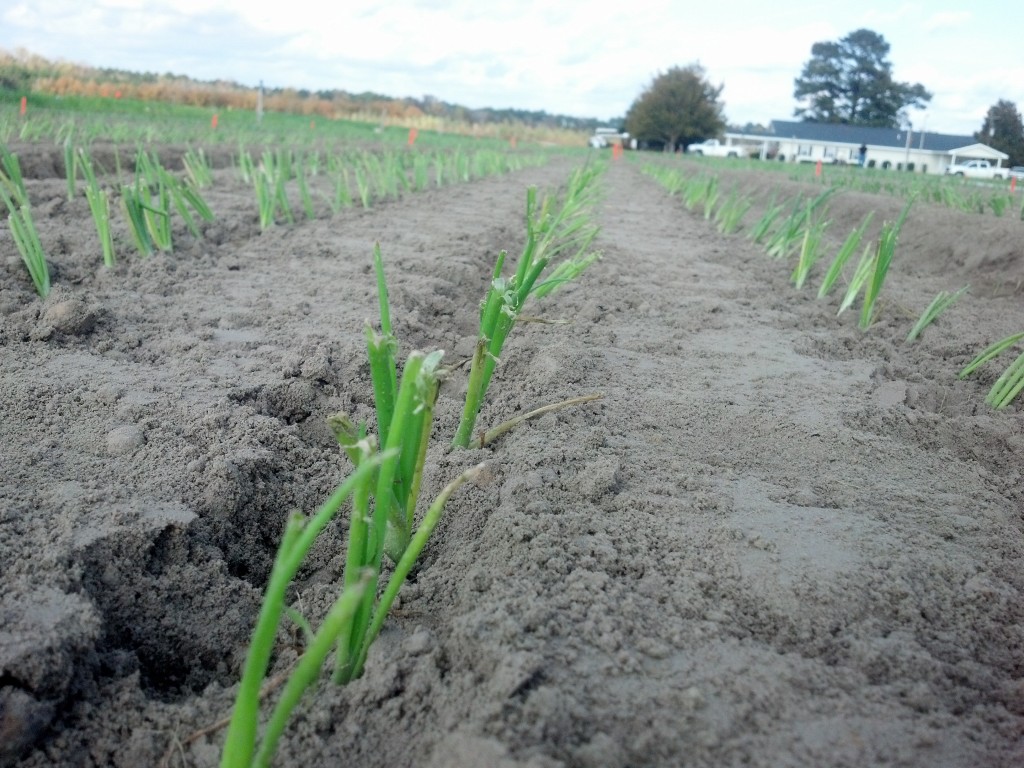
This past May was extremely hot and dry and whenever we have weather extremes it gets me thinking. How does our weather today compare to the past? More specifically, the decade of the sixties and seventies. The reason I concentrate on these decades is because this was a time of cooler and wetter weather. Many people I have spoken with would say when I was growing up it was never this hot and dry like today and during this time the earth began experiencing a short cooling phase. So, I decided to do some digging and see just how those decades compare to today.
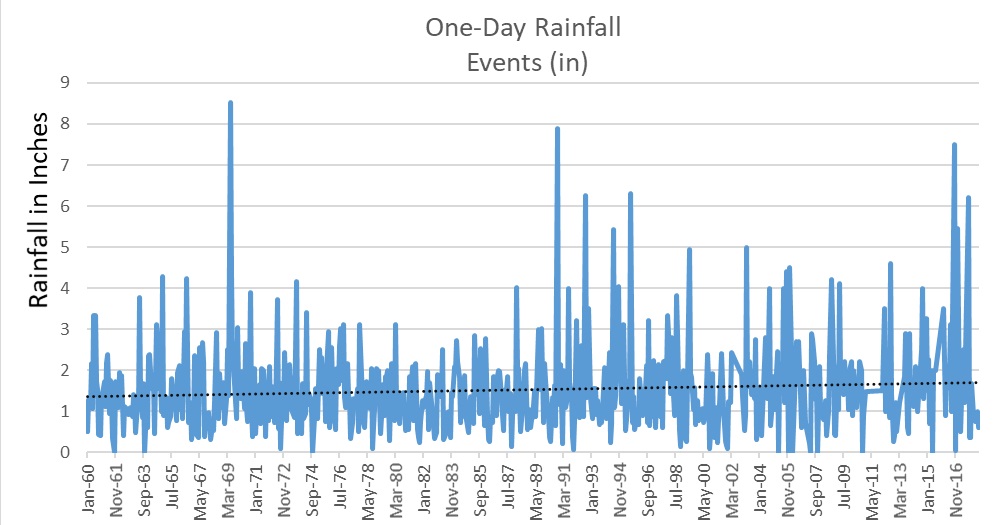
Figure 1. Daily One-Time Precipitation Events.
Figure 1 is monthly breakdown of one-day rainfall events. Looking at January of 1960 (far left) until around May 1989 the amount of extreme one- time events remained somewhat consistent, meaning that the high and low one-time events didn’t fluctuate too dramatically. However, this began to change around 1988. Then starting in the nineties to today look at the increase of high rainfall events. Also, notice the amount of extreme fluctuations of high rainfall to none and compare that to far left of figure 1. In fact, the top 10 highest rainfall events for this period occurred from 1990 to 2012. An interesting note on that statistic is that half occur in the nineties and the other half occur in our current decade. This trend can be further stressed by the positive slope of the black trendline.
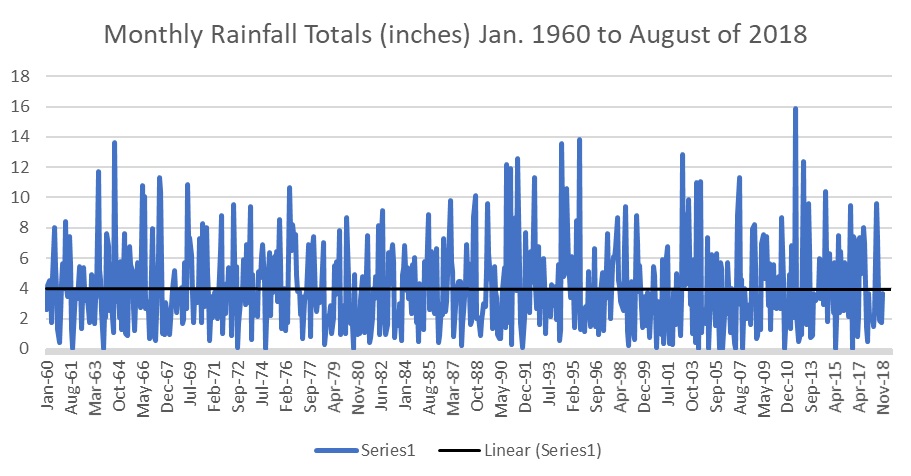
Figure 2. Monthly Rainfall Totals.
Figure 2 is a graph of monthly rainfall totals. The black line is a trendline indicating that total rainfall has been remained fairly constant in terms of total monthly rainfall. However, from figure 1 we can infer that yes rainfall totals have remained relatively stable during this period but the intensity and frequency has increased. Figure 2 shows more variable dry and wet periods of very little rainfall then larger rainfall events when compared to the 1960s and 1970s. It may seem odd that rainfall has remained steady throughout the last 60 years even with increasing intensity, but when taking into account the longer dry periods the excessive wet periods simply bring our totals back to our historical averages.
So, what does this all mean? Well, from looking at the information I would conclude that larger rainfall events are becoming more frequent. And with this increased rainfall intensity, less infiltration of that rainfall is likely. With less infiltration, runoff and soil loss will likely increase. Loss of fertilizer to streams and ponds is also likely as well as increased loss due to excessive leaching.
It is predicted that the Earth’s temperature will continue to rise this century. Will this increase in temperature lead to more rain, hopefully, because as temperatures increase so should evaporation. If we begin to see more evaporation and rainfall totals remain constant we will undoubtedly run into a situation of inadequate rainfall.
All climate data was collected from the MRCC Midwestern Regional Climate Center.