-

NOAA released their latest summary for May, spring (March-May) and year to date for the US today. You can see the summary at https://www.ncdc.noaa.gov/sotc/summary-info/national/201605. The summary shows that for May, the country as a whole was fairly close to the long-term average, although some regions were colder or warmer than average, particularly the Pacific Northwest.…
-
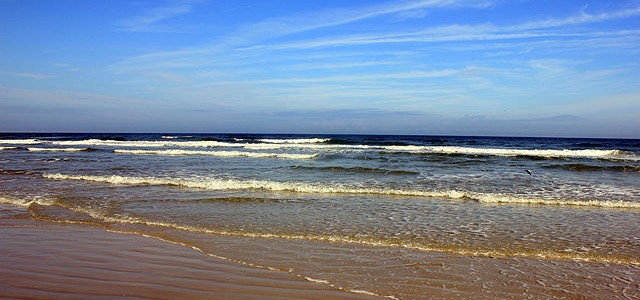
EarthSky noted on their blog this morning that today is World Oceans Day. It is a celebration of all that is good with the world’s oceans. In honor of the occasion, they have some very nice ocean photos at https://earthsky.org/todays-image/your-best-ocean-photos. In addition, they published a link to NASA’s Perpetual Ocean, a visualization of ocean currents around…
-
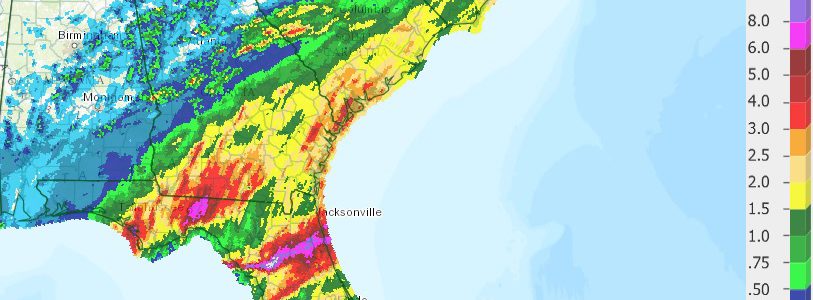
Tropical Storm Colin has come and gone, and you might wonder how much rain we got from the storm as it passed. Of course, the amount you got depends critically on where you are. Here in Athens where we were just on the edge of the storm I got a paltry 0.22 inches, and not…
-

The Southeast Farm Press noted the occurrence of relatively rare weather-related damage to tobacco plants in North Carolina this week. This damage is called Weather Fleck. Matthew Vann, NC State Extension Tobacco Specialist, noted that “This event is 100 percent weather related due to the fact Weather Fleck is caused by ozone (O3) which is…
-
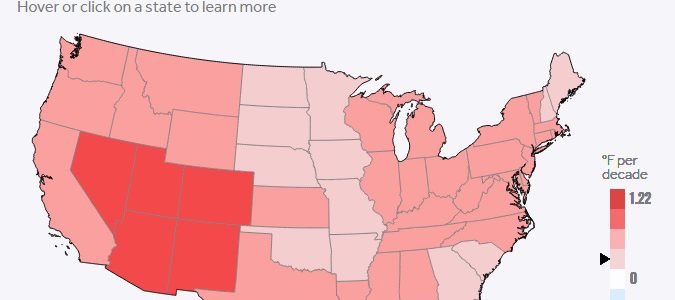
Climate Central has produced an easy to use map which provides color-coded information about trends in temperature across the country. You can find it here. It’s interesting to see how the trends change by region as well as season. In the Southeast, the highest warming trends have been occurring in winter and summer, with less…
-
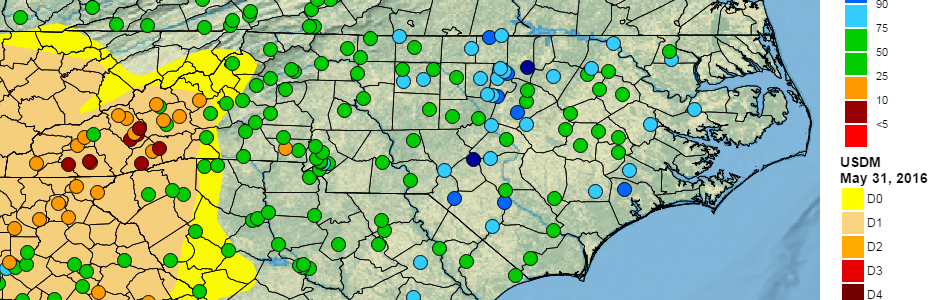
The State Climate Office of North Carolina released their latest outlook for summer for North Carolina this morning. While it is specific to NC, a lot of the information in it is generally true for the entire Southeast. You can see it at https://climate.ncsu.edu/climateblog?id=193&h=5666e5c1.
Posted in: Climate outlooks -
The History Channel has an excellent retrospective on the D-Day invasion of Normandy, France, which occurred on June 6, 1944. The weather forecast for that event was crucial in making it a success. You might enjoy reading about it and watching some video at https://www.history.com/news/the-weather-forecast-that-saved-d-day. USA Today also had a feature about this in 2014 which…