Tools for climate and agriculture
-

If you live near a river or water body, you might wonder whether or not your property is in a flood plain. Here is a website which shows maps of flood risk for anywhere in Georgia. You can enter your address and it will create a map of your location with any flood plains that…
-
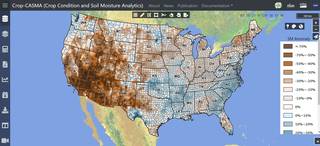
Earlier this week, the USDA released a new soil moisture tool that is powered by NASA satellite data. The Crop Condition and Soil Moisture Analytics (Crop-CASMA) app provides access to high-resolution data from NASA’s Soil Moisture Active Passive (SMAP) mission and the Moderate Resolution Imaging Spectroradiometer (MODIS) instrument. It will help researchers, meteorologists and farmers…
-

With the cold weather we have been having in the Southeast (although it is nothing compared to Texas and the central US), the number of chill hours that our fruit crops have received this year is quite a bit more than last year, although still below the long-term average amounts. That means that most varieties…
-

I am attending a virtual conference hosted by the Midwestern Regional Climate Center this week. One of the talks reminded me of the great resources they have on their web site. If you go to https://mrcc.illinois.edu/clim/ and look under Resources, you can find climate maps as well as GIS-based station statistics. They include national maps…
-
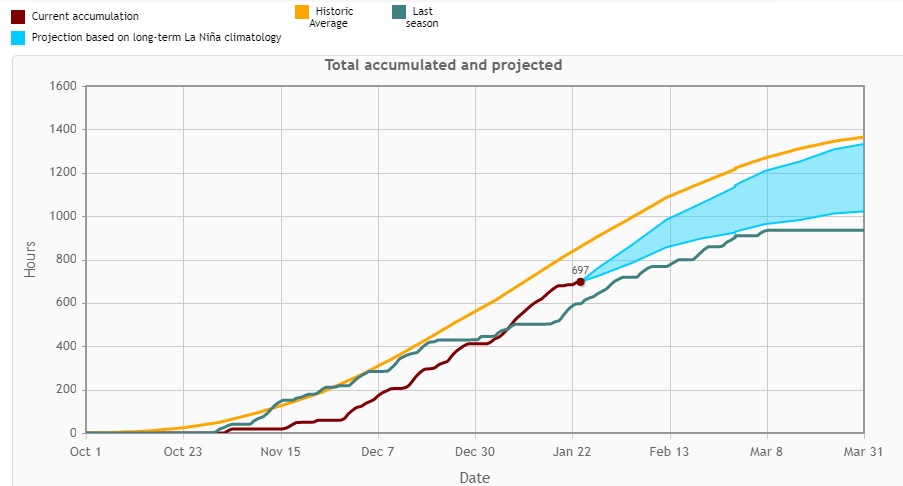
At this time of year, fruit farmers are anxiously watching their chill hours to see if they have received enough cold weather to help their plants produce a good set of flower buds for spring bloom. In the past few years, some winters have been touch or go with having enough. Early this year, it…
-

The Drought.gov web site has gotten a fresh new look! The new Drought.gov includes easily accessible and shareable information, up-to-date drought conditions and forecasts down to the county and city level, interactive maps and data that don’t exist anywhere else, and a new “By Sector” section showing drought’s impacts on different economic sectors. If you…
-
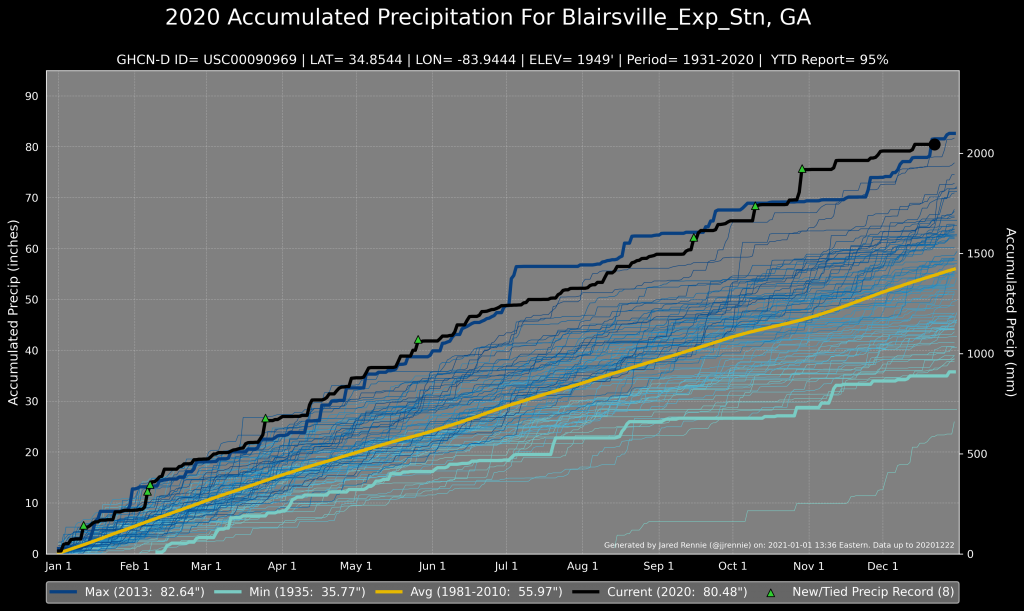
Here is a new web site that you can use to show year-to-date temperature and precipitation for individual stations across the US. It includes accumulated degree days as well. You can view it here and click to pick your station of interest. Use the Layer list to pick what variables you want to see. The…