Tools for climate and agriculture
-

As we go into the hottest part of the year, it is important to monitor conditions to make sure you are protecting yourself, your family, and your workers against heat illnesses. The North Carolina State Climate Office has produced a new map tool that shows how the wet bulb globe temperature (WBGT) is distributed across…
-

The USDA has recently released a new publication on drought and forage production in the Southeast. It is authored by Dr. Lisa Baxter, UGA forage specialist, and contains information about how to prepare for droughts, handle them when they occur, and what you can do to prepare for the next drought. You can find the…
-
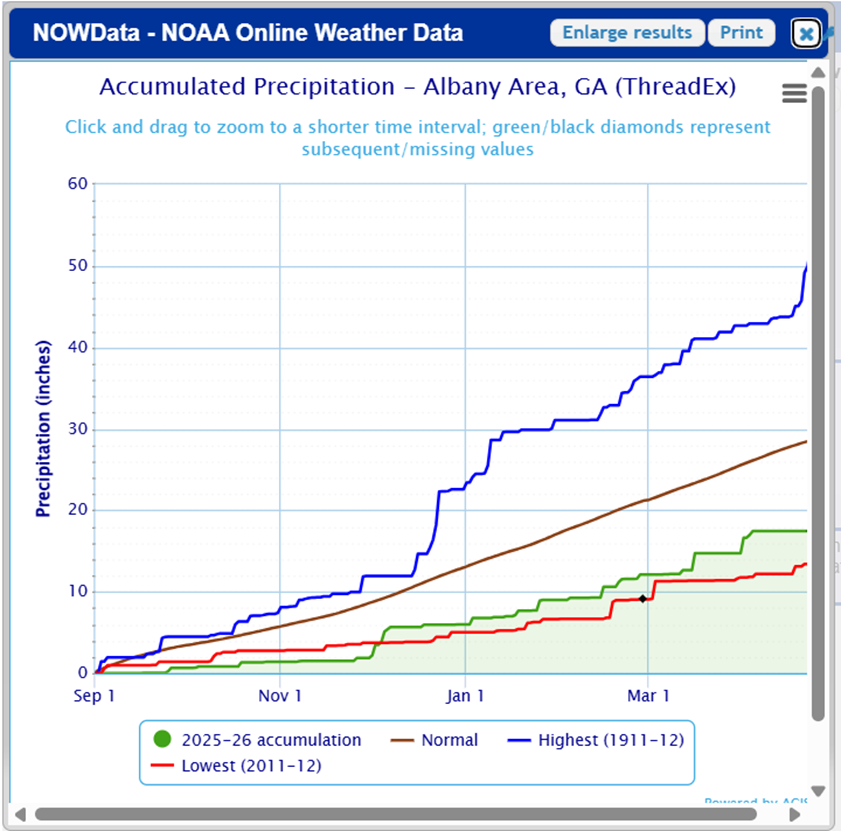
While I was working on slides for a talk tonight, I ran across this website from the National Weather Service that provides a way to generate temperature and accumulated precipitation graphs that I had not seen before. The accumulated precip graphs were very helpful for a presentation on the drought we are experiencing now in…
-
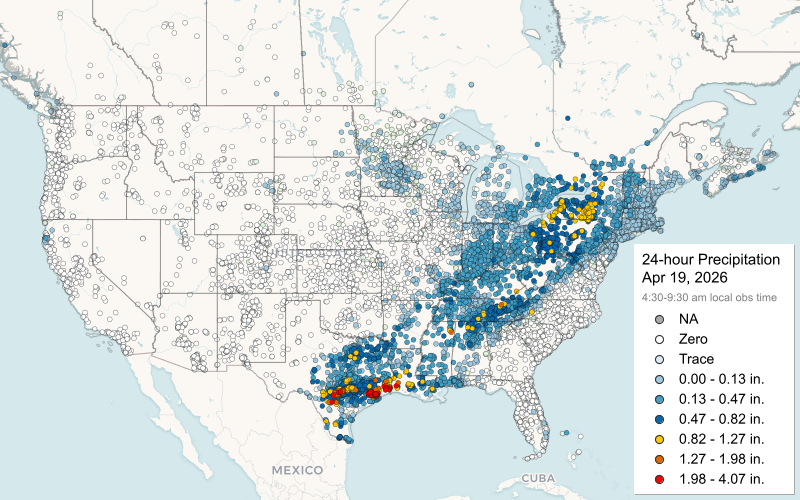
We are more than halfway through the month of April, which is the month in 2026 that the CoCoRaHS network works hard to recruit new observers to their network of volunteer weather observers. CoCoRaHS stands for Community Collaborative Rain Hail and Snow network, which started in Colorado in 1998 following a devastating flood in Fort…
-
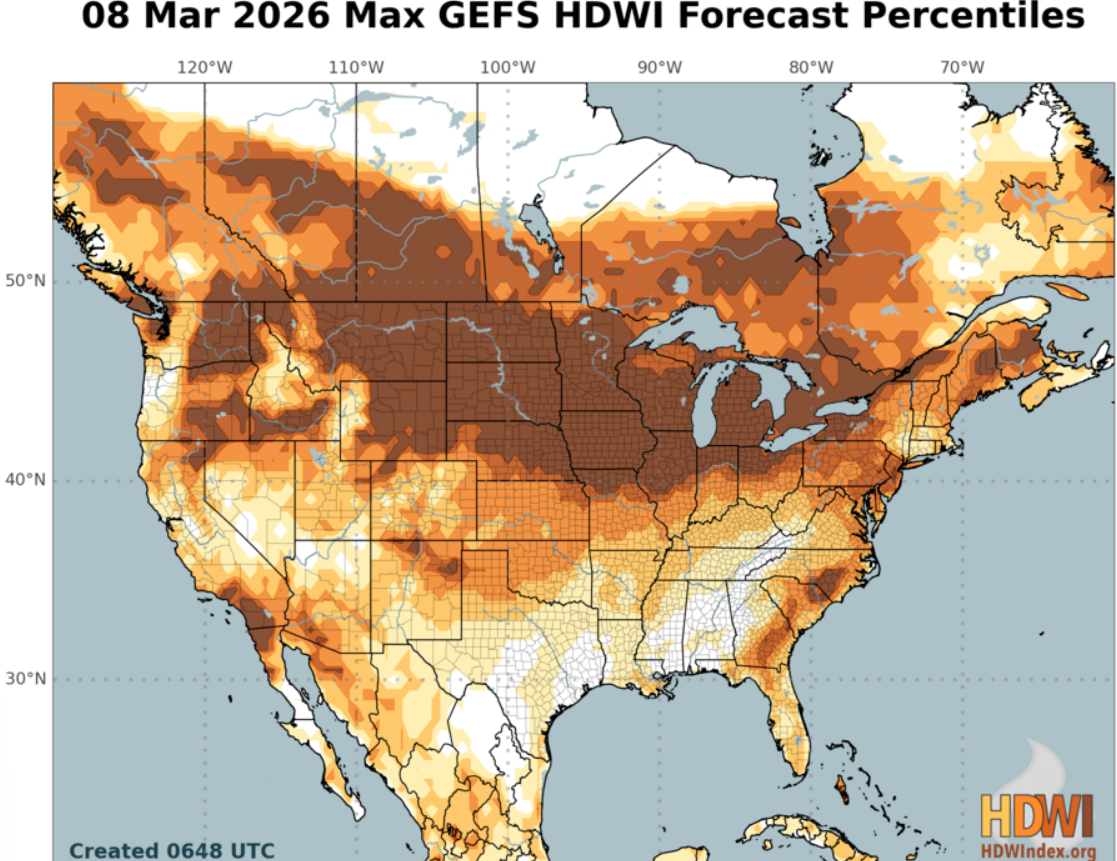
The Hot-Dry-Windy Index (HDW) is a new index produced by USDA that is now available online at https://hdwindex.fs2c.usda.gov/index.html. It was designed to help users determine which days are more likely to have adverse atmospheric conditions that make it more difficult to manage a wildland fire. It combines weather data from the surface and low levels…
-

Evapotranspiration data is part of the necessary water balance information that farmers need to determine irrigation needs. But it has been hard for many producers to come by, especially in states without mesonets that calculate it using their meteorological data. Here is a new online source of ET information called OpenET that helps reduce that…
-
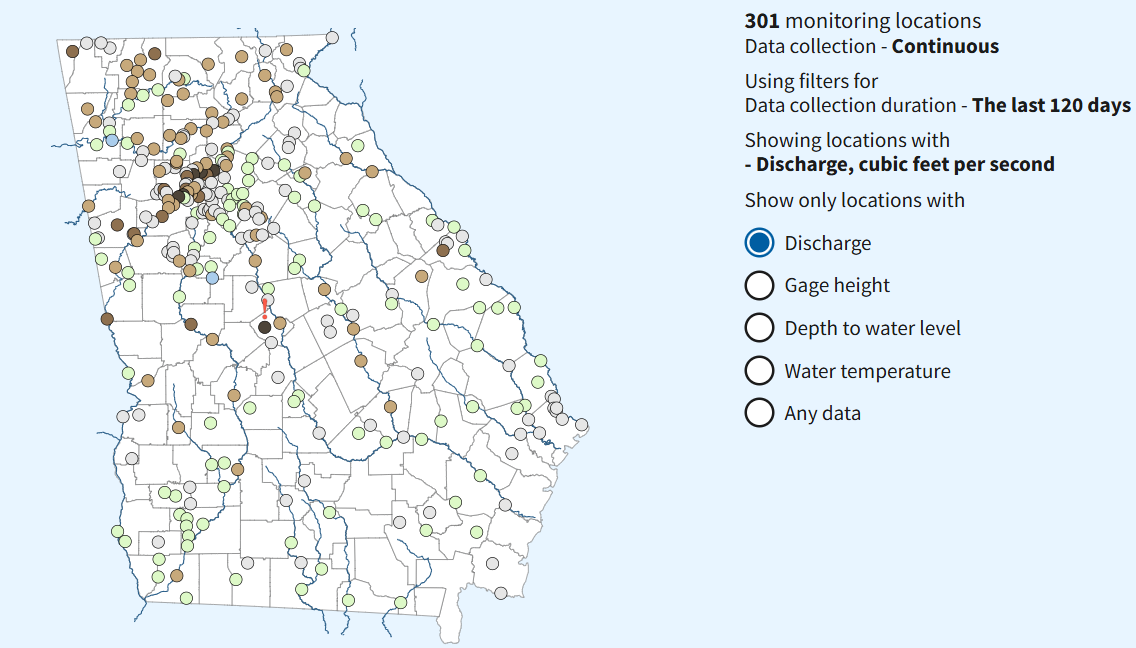
If you use USGS streamflow, groundwater, or precipitation data, you will want to know about this. USGS is going through a modernization process and will be ending much of their pre-calculated statistics information by the end of 2025 or very early 2026. Thus, WaterWatch will be decommissioned. Realtime and monthly (for the prior month) streamflow percentiles will…