Pam Knox
-

Modern Farmer reported this week that recent studies of the effectiveness of permethrin, a pesticide commonly used to combat mosquitoes, is less effective in warmer conditions than expected. This has implications for future summers, since trends towards warmer temperatures are likely to make conditions in the Southeast and elsewhere more favorable for longer mosquito seasons…
Posted in: Climate and Ag in the news -

US Department of Agriculture Secretary Vilsack posted a new blog entry to the USDA web site this week. In it he discusses the challenges and opportunities agricultural producers have in feeding a growing number of people on earth in the future. As you might expect, farmer, ranchers and foresters play a critical role in producing…
Posted in: Climate and Ag in the news -

Rainfall across Georgia in November was wetter than average for most of the state, with the exception of the southeast portion of the state. Some areas in the mountains received more than ten inches above normal precipitation, hindering farmers who are wrapping up the harvest season and preparing for winter. Temperatures in Georgia were several…
Posted in: Climate summaries -

One of the consequences of changes in climate such as drought is an impact on the soil structure and the agricultural infrastructure on which it sits. The Guardian posted an article a few days ago describing the impacts of continued massive pumping of groundwater in California on the surface topography, where land is sinking at…
-
The Southeast Regional Climate Hub’s latest newsletter is now available here. It includes a number of meeting announcements, updates, and short articles, including one on managing swine in an El Niño year. Check it out!
-
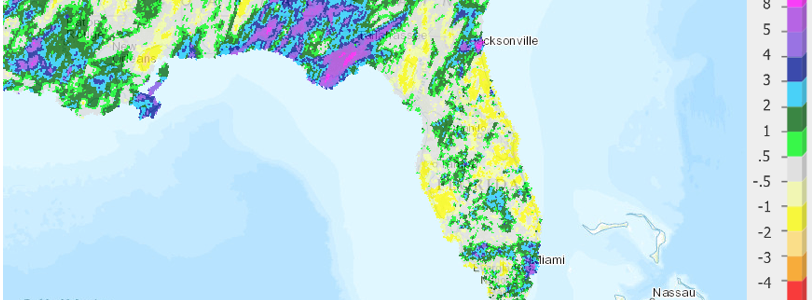
The November 2015 issue of the Florida climate summary is now available at https://climatecenter.fsu.edu/products-services/summaries/climate-summary-for-florida-november-2015.
Posted in: Climate summaries -
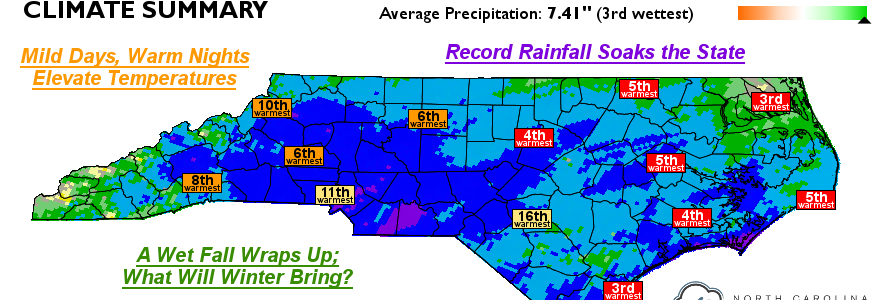
The State Climate Office of North Carolina has released their monthly and seasonal climate summary for North Carolina for November 2015. You can read it at https://climate.ncsu.edu/climateblog?id=167&h=5666e5c1.
Posted in: Climate summaries