A website from UGA Cooperative Extension

Food, Agriculture, and Resource Economics

Recent Posts

  • A recent court case striking down the agricultural exemption for reporting under the Comprehensive Environmental Response, Compensation, and Liability Act (CERCLA) means that many producers will have to start reporting complicated emissions information in May of this year. Currently, a federal Senate bill is being considered that will make the exemption legal, but congress must act swiftly.

    In the event that action by congress fails or is delayed, producers should be aware of the rules and how they will impact their operations. Extension agricultural lawyer Paul Goeringer has a pair of short podcast episodes available that explain the rule. Click below to listen!

    Part 1

    Part 2

  • by Don Shurley and Adam N. Rabinowitz

    We have developed a third publication in a series of fact sheets on the new seed cotton program. Included in this document is a little history of what happened with the 2014 farm bill that led to the development of the seed cotton program.  We provide an example of the decision process and identify things to think about when making the decision.

    The PDF can be downloaded here.

  • by Don Shurley and Adam N. Rabinowitz

    This post presents a second fact sheet in a series of publications that briefly explain the basic workings of the new seed cotton program.

    Effective with the 2018 crop, “seed cotton” is now a covered commodity under Title I of the 2014 farm bill and eligible for PLC (Price Loss Coverage) payments. For purposes of the legislation, “seed cotton” is unginned upland cotton—a combination of both cotton (lint) and cottonseed.

    The linked document discusses:

    • Reference price and payments,
    • Marketing year average prices and how to calculate them,
    • What would have been the past 10 years had the seed cotton program been in place,
    • Payment yields, and
    • A payment calculator

    Click on this link to access the factsheet.


  • by Levi A. Russell

    UPDATE

    The big questions left on the table back in February when the Bipartisan Budget Act was passed have been answered. The information below in the original post is still correct, but I wanted to fill in the gaps here.

    Re-enrollment for 2018 CAT-level and buy-up coverage began on April 9th 2018 and ends on June 1st 2018. All outstanding balances for 2017 and prior years must be paid in full before a dairy operation can be approved for 2018 coverage.

    Coverage elections made for 2018 under the re-enrollment will be effective retroactive to January 1st 2018 for eligible dairy operations.

    All dairy operations that want to participate in MPP in 2018 must sign up during the re-enrollment period.

    During the 2018 re-enrollment period only, producers in dairy operations with an active policy under LGM-Dairy who have target marketings insured during months in 2018, will be allowed to register for 2018 coverage under MPP-Dairy while still meting the contractual requirements for the LGM-Dairy contract. Producers may participate in either LGM-Dairy or MPP-Dairy, but not both.

    Example: A producer purchases LGM-Dairy in November 2017 with target marketings through April 2018. Coverage under LGM-Dairy will conclude at the end of April 2018, and coverage under MPP-Dairy may begin May 2018. Premiums for 2018 will be prorated based on when LGM-Dairy coverage ends and MPP-Dairy coverage begins for 2018.

    Dairy economists at DairyMarkets.org have a longer fact sheet with several examples of coverage benefits calculated based on projections done in February 2018.

    The MPP decision tool on their site has also been updated with the latest policy information, so you can calculated projected indemnities for 2018.

    For more information about the changes and enrollment, contact your local county agent or FSA office.

    ORIGINAL POST

    The Bipartisan Budget Act of 2018 made some significant changes to the Margin Protection Program for dairy producers. These changes apply beginning with the 2018 calendar year and make the program more producer-friendly and substantially decrease premiums for Tier I coverage. The specific changes are as follows:

    -Dairy-MPP now operates on a monthly basis. Feed costs, milk prices, the margin, and payments are all calculated or paid monthly. There are no additional changes to any of the formulas to compute these costs, prices, margins, and payments.

    -The 2018 election year is extended by at least 90 days after the enactment of the Bipartisan Budget Act of 2018 (February 9, 2018)

    -Limited resource, beginning, veteran, and socially disadvantaged farmers are exempt from the administrative fee associated with Dairy-MPP

    -The base production history is maintained

    -Tier I premiums now apply to the first 5,000,000 pounds of production instead of the previous 4,000,000. Tier II covers production in excess of 5,000,000 pounds

    -Premiums for Tier II are unchanged. Premiums for Tier 1 are lowered as follows:

    Coverage LevelOld PremiumNew Premium
    $4.00NoneNone
    $4.50$0.010None
    $5.00$0.025None
    $5.50$0.040$0.009
    $6.00$0.055$0.016
    $6.50$0.090$0.040
    $7.00$0.217$0.063
    $7.50$0.300$0.087
    $8.00$0.475$0.142

    Sources:
    Bipartisan Budget Act of 2018

    7 USC Chapter 115, Subchapter III, Part A
    Posted in: ,
  • by Don Shurley and Adam N. Rabinowitz

    On the morning of February 9, 2018, the U.S. Congress passed budget legislation that included the designation of seed cotton as a covered commodity under the 2014 farm bill. The President has signed this legislation and it has become law. The document linked below highlights the critical components about the new cotton program and treatment of Generic Base.

    The Bipartisan Budget Act of 2018

    More information, including a decision aid, will be available soon at https://agecon.uga.edu/extension.

  • by Levi A. Russell

    A couple of recently-released reports provide some interesting observations about the state of the beef industry and some good news for the long run as well.

    Beef Demand

    First, a few of my colleagues at Kansas State and Purdue Universities have written an extensive report on many drivers of beef demand. Below I reproduce the Executive Summary, but the rest of the report is also informative:

    Several key findings are of elevated importance:

    1. Over the past decade, the quantity of beef consumers purchase has become less sensitive tochanges in beef prices yet more sensitive to consumer incomes. This could be a result of record high retail beef prices in recent years that resulted in loyal beef consumers, who are less price sensitive, having the strongest presence in the market. As consumer incomes have grown, more consumers who might have been priced out of the beef market, have allocated some of that income growth to purchase beef again thus increasing beef demand response to growing income.

    2. The relative impact of pork and chicken prices on beef demand is economically small relative to other factors. This does not imply individual beef, pork, and chicken products are not substitutes, rather the substitutability in aggregate is just not as strong as traditionally thought.

    3. Print media and medical journal coverage of topics around beef changes notably over time in areas of focus and volume of coverage. Certain types of media coverage are found to affect meat demand, and an emerging area of negative impact focuses on climate change. Having an impactful presence in the media is immensely important as it shapes perceptions.

    4. Some demographic trends are favorable for beef demand including anticipated growth of Hispanic and African-American populations within the U.S.

    Cattle Inventory

    On January 31, the 2018 cattle inventory report was published by the USDA. This report compares inventory levels on January 1, 2018 to those of January 1, 2017. This report is a great opportunity to see what is happening on the national scale for cow-calf producers and in the feedlots.

    This year’s report tells a familiar story: slow herd expansion. Nationwide, the herd has been expanding since hitting a bottom in 2014. The previous several years saw a decline due in part to serious drought in the western U.S. Expansion in the herd overall was only 1%, significantly slower than the previous few years. This was expected, as we’ve seen slaughter rates for beef heifers and cows pick up significantly in the last couple of years. This year’s report showed a 4% reduction in the number of heifers currently held as beef cow replacements, indicating that during 2018 we will likely see very little to almost no growth in the herd. Finally, the calf crop increased 2% relative to last year and the number of cattle on feed increased 7%. This pre-report commentary provides additional context to the report.

    As we continued to see slower herd growth and some bright spots for beef demand, I’m cautiously optimistic that we will be able to maintain profitable calf prices and stocker margins through 2018. If you have questions, please don’t hesitate to contact me at lrussell@uga.edu.

  • by Levi Russell

    Last year an overhaul of the tax code was passed by Congress and signed into law by President Trump. We thought we would put together a resource page on the aspects of the law that will affect agricultural producers.

    First, a rather lengthy article covering all aspects of the new law that will affect agricultural producers. This piece is written by Roger McEowen, an agricultural tax lawyer in Kansas. I have confirmed with the author that the information in this article is up to date.

    Second is a post by another agricultural lawyer focusing primarily on the estate tax changes.

    Finally, a 17 minute radio interview on major tax and agricultural law issues for the new year.

    Posted in: ,
  • by Levi A. Russell

    Board prices for feeders and fats have been quite strong in the past few months and Georgia producers have seen similarly strong prices in our cash markets, relative to seasonal expectations. The typical seasonal downward slide into October and November has not appeared and prices have been more or less flat since the summer. One of the threats to strong prices in coming years is a continuation of herd expansion.

    David Widmar, an ag economics consultant with Agricultural Economic Insights, did a great job recently of digging into the state-level inventory numbers to see if we will see continued expansion through 2018. Ad Widmar notes, Texas cattle numbers made up a large percentage of the recent inventory decline and have also made up a large percentage of the recent increase in inventory. However, Texas has not fully recovered its previous inventory level, so there is still some growing room out there, indicating that we will likely see more herd expansion. You can read Widmar’s full analysis by clicking here.

    This year, strong demand and low feed costs have helped buoy prices despite continued herd expansion. Time will tell if continued demand strength will absorb the price-reducing effect of larger beef supplies.

    Posted in:
  • by Adam N. Rabinowitz

    The 2017 peanut harvest is well underway with over 70 percent of the Georgia crop dug and over 50 percent harvested.  While Hurricane Irma negatively impacted the cotton crop, there was no widespread negative impact on peanuts.  Both irrigated and dryland peanuts are looking good.

    Peanut yields in Georgia and the rest of the peanut producing states will be up from last year with the big question being by how much and whether new records will be set.  USDA forecasts for the U.S. are for a yield of 4,257 pounds per acre with the GA yield at 4,700 pounds per acre, both of which would set new records.    With 1.9 million acres planted in the U.S. and 840 thousand acres planted in GA, this crop also has the potential to set a new record level of production.

    A few questions have surfaced that are worth discussing as we wait for the harvest to be completed in the coming weeks.

    • Is there sufficient warehouse capacity to store the expected crop?
      As of mid-September there were 3.8 million tons of approved warehouse capacity in the U.S. with 1.9 million tons in GA.  At first look, this has the potential to create a shortage of warehouse space of about 118 thousand tons in the U.S. and about 12 thousand tons in GA.  However, expectations are that a worst case scenario would be a logistical issue and not a question of where to store these peanuts.  Coming into this harvest, warehouses have been basically empty and shellers are prepared to start moving the current crop through the system.  Combine that with a longer than typical planting season and the industry should have little problem in finding space for these peanuts.
    • What is the size of this crop going to do to market prices?
      This becomes a question of supply and demand.  Basic economics tells us that as the supply increases prices will be driven down.  There is little anyone can do to prevent the supply situation at this point, so one must look towards demand.  The industry needs to continue to look for opportunities to expand demand in order to maintain or increase prices.  We have seen domestic use of peanuts for food increase in recent years but there are few opportunities to impact consumer demand in a short period of time.  The greatest opportunity for finding a market for this crop is through increased exports.  Through August, total U.S. exports have been down compared to last year, and this is likely due to prices that increased late last year.  While it is likely that exports will pick up, there is little indication that it will be without a drop in price.  Right now the market is waiting to see how large this crop will be and that will determine how low the price will go to move this crop.  Even with exports forecast to increase from last year, the ending stock created by this crop is expected to reach the heights of 2012.  The industry needs to find a home for these peanuts as prices will be impacted until this surplus can be moved.

    So the big question of course is whether the crop will meet these yield expectations.  We really won’t know until the harvest is complete but we can look at some of the historical USDA projections to get an idea of how accurate they have been in forecasting yields.

    As can be seen in the figure above, the blue line represents the actual yield in GA and the orange line represents the October forecast yield released by the USDA.  This graph starts in 2006 which was when Georgia-06g was released.  This variety currently represents about 80 percent of the peanuts planted in GA.  We can see that every year, except the last two years, the USDA October forecast was less than the actual final yields.  Generally this would project a very favorable expectation on the USDA forecast model as typically underestimating yields.  There is further evidence of underestimating in 2012 when there was a big spike in yield such as is expected this year.  The two most recent years when the USDA overestimated yields were during a period of a downward trend from the peak.  It will be interesting to see what the final yield number is for 2017 and how that compares to the current forecast of 4,700 pounds per acre.  This is certainly a big spike in yield from our actual 2016 yield of 3,900 pounds per acre, but with no major crop and weather issues this year it might just be achievable.

  • by Brady Brewer

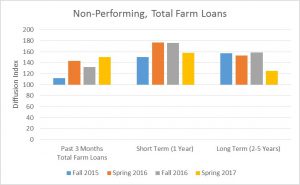
    In a recent survey of agricultural lenders from across the nation conducted by researchers at the University of Georgia and Kansas State University, agricultural lenders indicated that non-performing loans increased and lenders expected this pattern to continue in the short and long term (Brewer et al., 2017). Agricultural lenders were asked if they experienced an increase in non-performing loans in their loan service territory over the past three months as well as their expectations for non-performing loans over the short and long term for their loan service territory. This expectation is the strongest reported by agricultural lenders in the past two years. Lenders reported an increase in non-performing loans for total farm loans (see graph), farm real-estate loans, and operating loans. This expectation of increased delinquency represents deteriorating cash reserves farmers have given lower net farm incomes experienced nationally.


    The first step for farmers that may be at risk of becoming delinquent or past due on notes is to calculate their working capital position. Working capital is the amount of cash or near cash assets on hand after all current liabilities (e.g. expenses, current portions of long term debts) are paid. Working capital can be seen as the buffer for a farm to absorb any short term losses. It can also be seen as a measure of financial risk for the farm. The greater the working capital, the less financial risk a farm has.

    Farmers who are experiencing liquidity or working capital issues should implement strategies to prolong cash reserves for as long as possible. These strategies include: negotiating any long term leases, a thorough review of all operating expenses, prioritizing asset purchases, culling of old or unproductive assets, and sharing of assets if possible. These strategies will help minimize losses and make the farm more efficient in hopes of bolstering the working capital positions of farmers.

    It is also important that farmers be open and up front with their lenders concerning any possible late payments or cash flow issues that may hinder loan repayment. Lenders have reported that they are more flexible with farmers who provide advanced notice of financial issues. This provides the agricultural lender time to develop a plan that could be mutually beneficial for both the farmer and lender.

    Posted in: ,