-
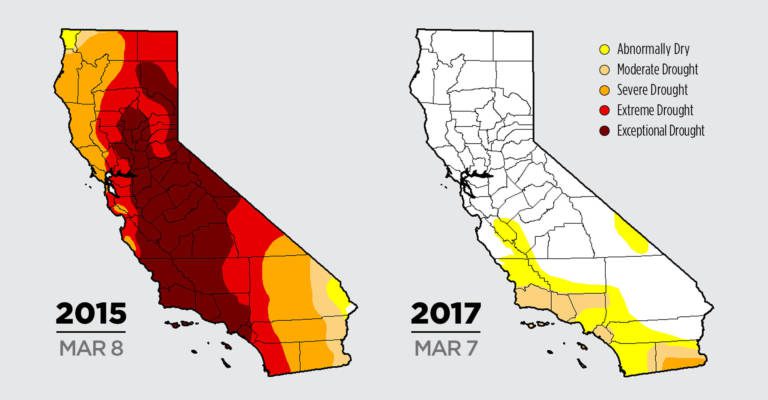
Here’s an interesting story about how the Drought Monitor is made from KQED out west. It describes the combination of quantitative factors along with the art that makes the map come together. However, unlike the headline above, I know of a few examples where politics has also come into play, although for the most part…
-
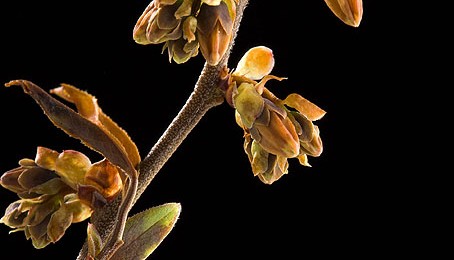
Farmers use a variety of techniques to help protect their vulnerable crops against frost damage when temperatures get near 32 F, including irrigation, large fans, or other heating methods. But it is hard to know when to start the frost prevention measures, because if you wait until it gets to 32 F, then it is…
-
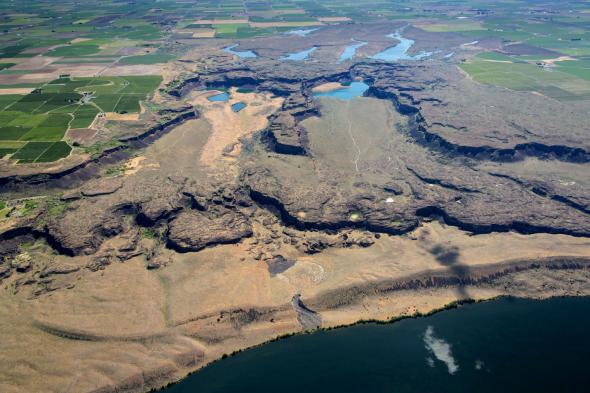
I love geology! Growing up in Michigan I could see evidence of past ice ages all around me. It’s a little trickier to see evidence in the Southeast, but there are a few examples here. But one of the most widespread evidence of an Ice Age climate catastrophe can be found in eastern Washington, where…
-

In 1993 I was working in Wisconsin as the State Climatologist watching an incredible storm forecast for the Southeast with my husband John Knox, Birmingham AL native. The forecast was one of the best the National Weather Service at the time ever made, and the severity of the storm was well predicted far ahead. Even…
Posted in: History -
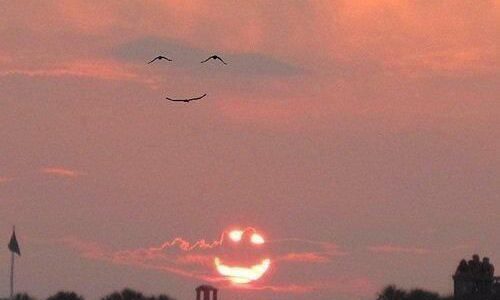
Did you wake up this morning already feeling behind? The loss of an hour last night probably contributed to that. Dr. Marshall Shepherd has an interesting post at Forbes.com today about Daylight Saving Time. You can read it here. I used to be more concerned about it when I worked in Wisconsin and was doing…
-

While here in the Southeast we have been experiencing an extremely warm winter, in the Pacific Northwest they are experiencing one of the coldest and wettest winters in at least 30 years. For younger folk born after 1985, it is the coldest winter they have ever experienced. Cliff Mass has produced a blog post which…
-

Here are some detailed global images of vegetation health, including several drought indices, fire danger and soil saturation maps as derived from the Suomi-NPP satellite. In addition to global maps you can view each variable by country. The detail is amazing! You can find out more about them at Climate.gov at https://www.climate.gov/maps-data/dataset/global-vegetation-health-images or go directly to…