Tools for climate and agriculture
-
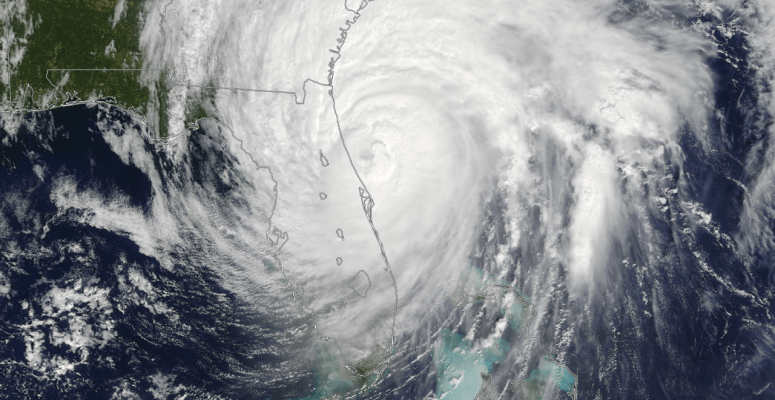
What do you do to prepare for hurricane season? Do you take an inventory of your belongings? Purchase flood insurance? Plan where to evacuate in case the storm comes right over your location? If you are like many Floridians, according to a recent AAA poll, you do none of the above. In fact, you probably…
-

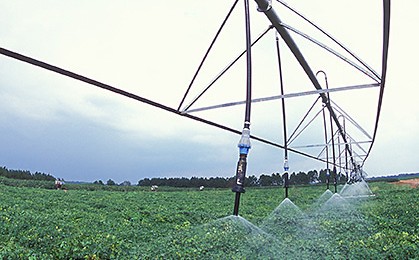
It’s raining outside my window right now, and I’m not really worried about drought in the near future, but the next drought is always around the corner and friends are currently experiencing one. Because of that, I want you to know about the new state pages on Drought.gov. They provided updated state-by-state information and resources…
-

The Climate Toolbox website is a collection of web tools for visualizing past and projected climate and hydrology of the contiguous United States. One of the sections that I find especially useful is the Agriculture page, which provides links to a variety of tools that can help producers plan for climate in the future at…
-

Here is a nice corn growing degree day (GDD) tool for the US available from Nutrien at Nutrien GDD Tool (ag-wx.com). You can input the location, planting date, and maturity level and get a curve that shows the corn development stage. It is based on PRISM gridded weather data developed by Oregon State University. Some…
-
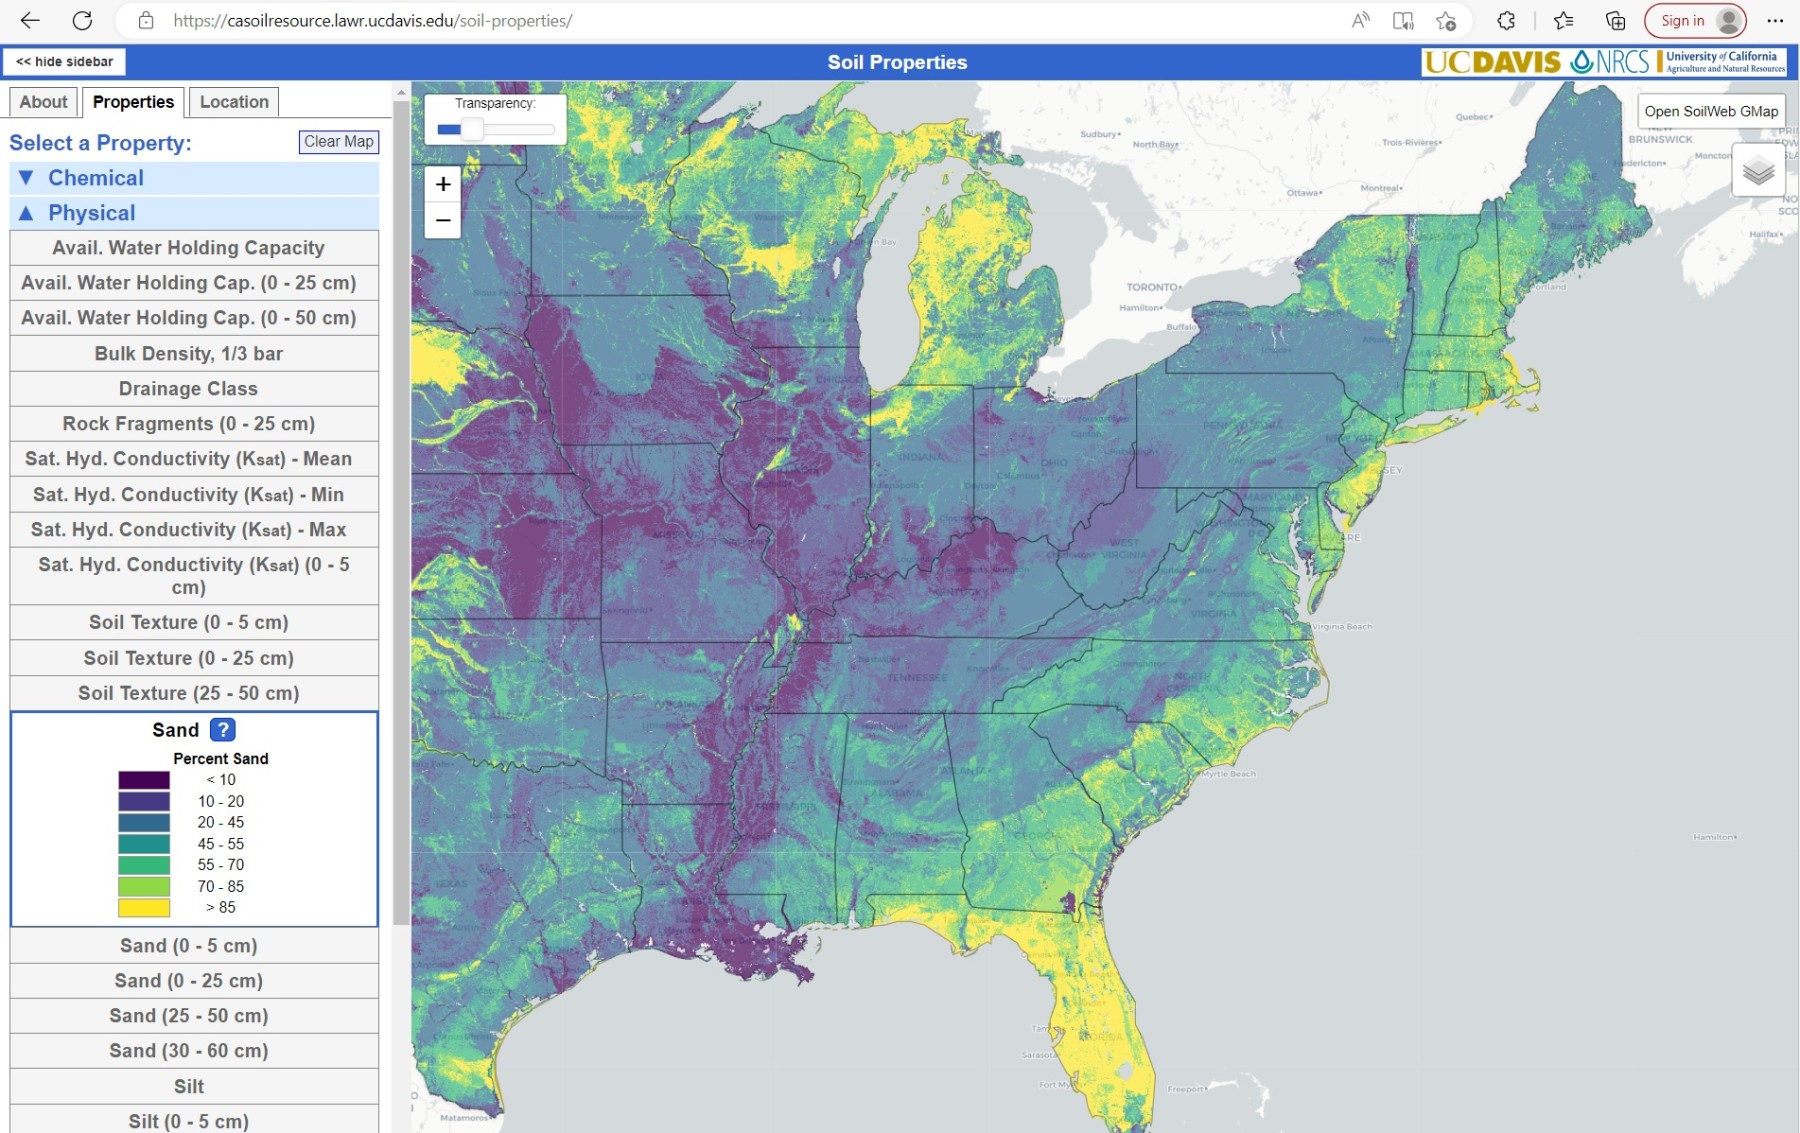
While the focus of this blog is on climate and agriculture, a good understanding of agriculture also requires knowledge of the soil that you are growing your crops in. I was intrigued to hear about this website that provides a way to do interactive mapping of a number of soil properties across the country at…
-
An ongoing study funded by the National Oceanic and Atmospheric Administration that is being conducted by the University of Alabama-Huntsville, the University of Florida and the University of Georgia is developing methods for identifying and quantifying the effect of flash drought with each university focusing on different strategies. Flash drought is often not captured by…
-
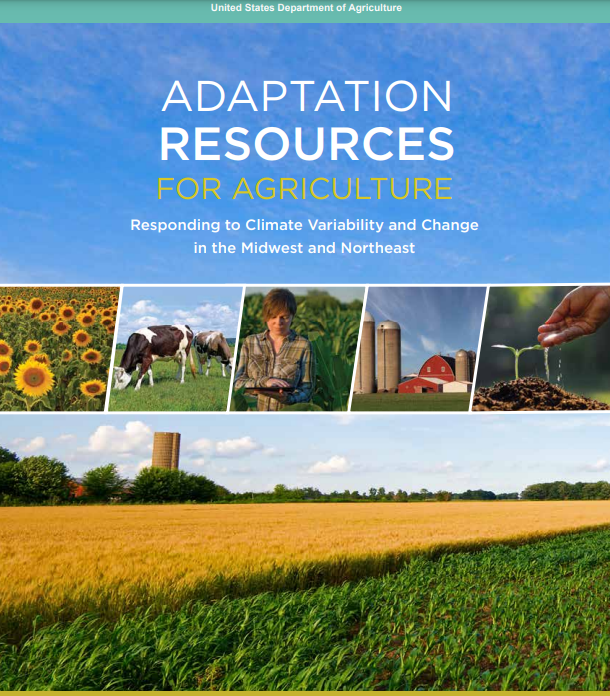
I recently ran across this USDA publication describing methods for adapting agriculture to increasing climate variability and climate change. While the publication is focused on the Midwest and Northeast, there are a lot of very good lessons for producers in the Southeast as well. I encourage you to take a look at it and see…