Tools for climate and agriculture
-
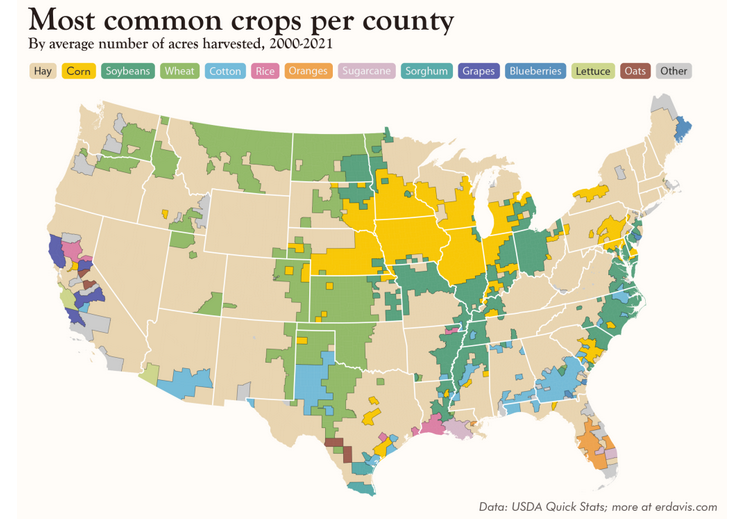
Here’s a neat data project showing the most common crop by acreage for every county in the United States. The overall winner is—hay! Of course, there is a lot of variation, with the Corn Belt having the most acres in corn (big surprise!), South Georgia in cotton, and eastern North Carolina in sorghum. There are…
-
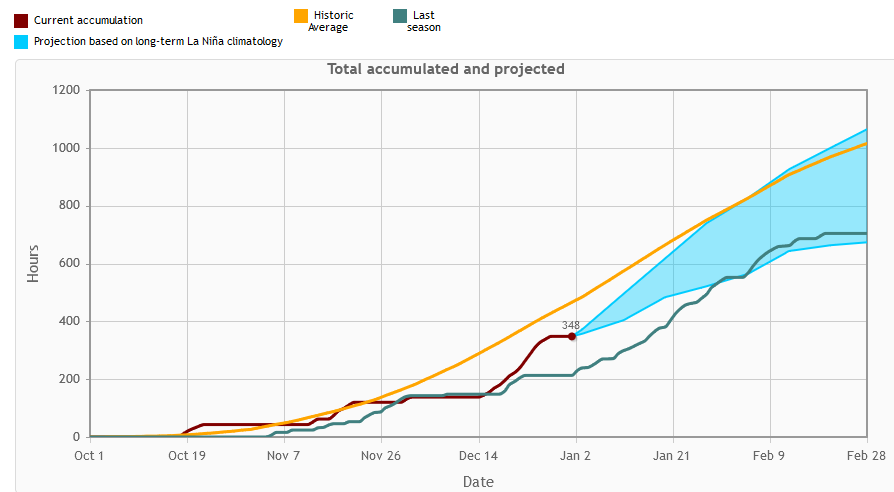
Chill hours are basically accumulations of the time that an area experiences a temperature below 45 degrees F, although there are several variations on this basic idea. Fruit trees need a certain amount of cold weather while they are dormant to set a good crop of fruit for the next growing season. This year, because…
-

As we get closer to the cold and snow that is expected in the next few days, you may be interested in viewing where the biggest impacts are occurring, especially if you are going to be traveling. NOAA has a good map depiction of where winter storm impacts are expected to occur over the next…
-
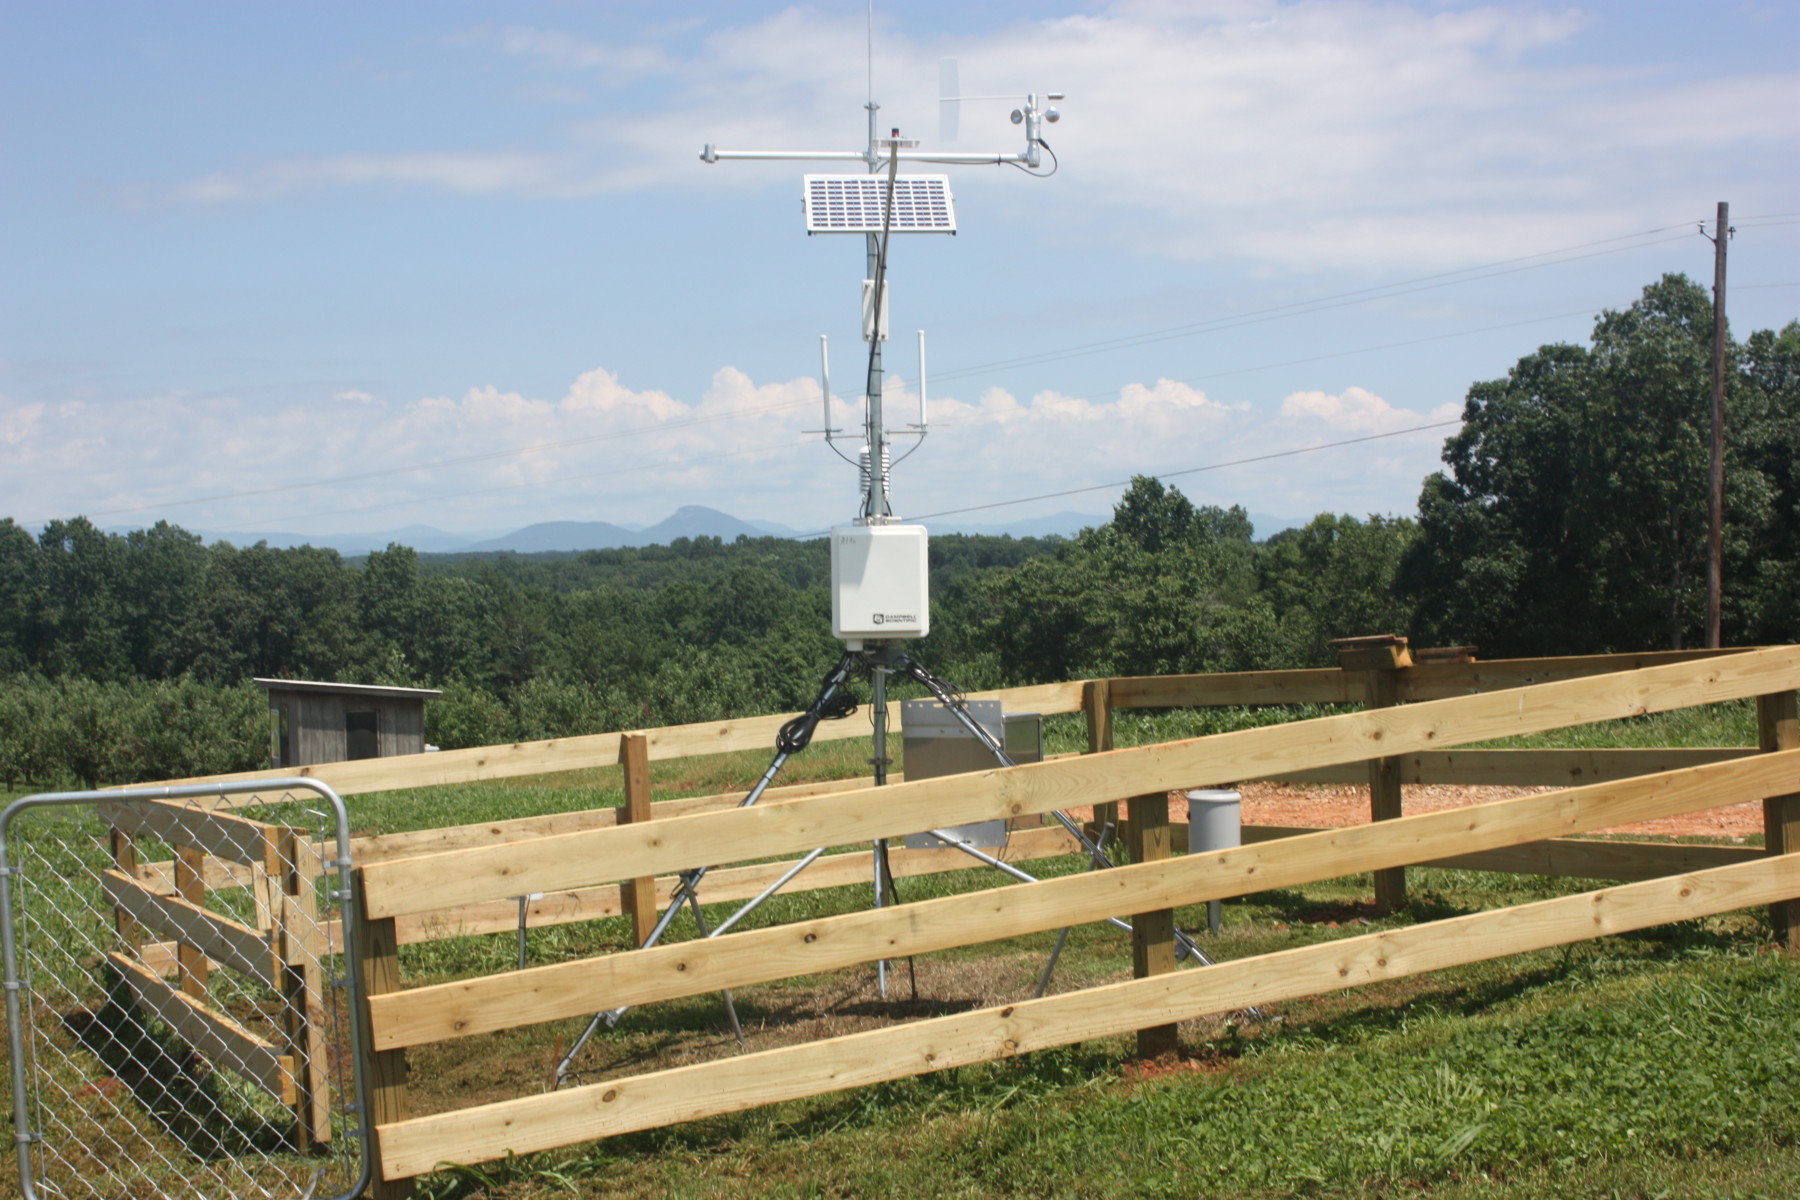
There are many different networks of weather observations that are taken across the country and the world. Some of the networks are run by the National Weather Service, US Geological Survey, and other federal agencies. Now, there are also many networks run within the states by different agencies. The University of Georgia weather network that…
-
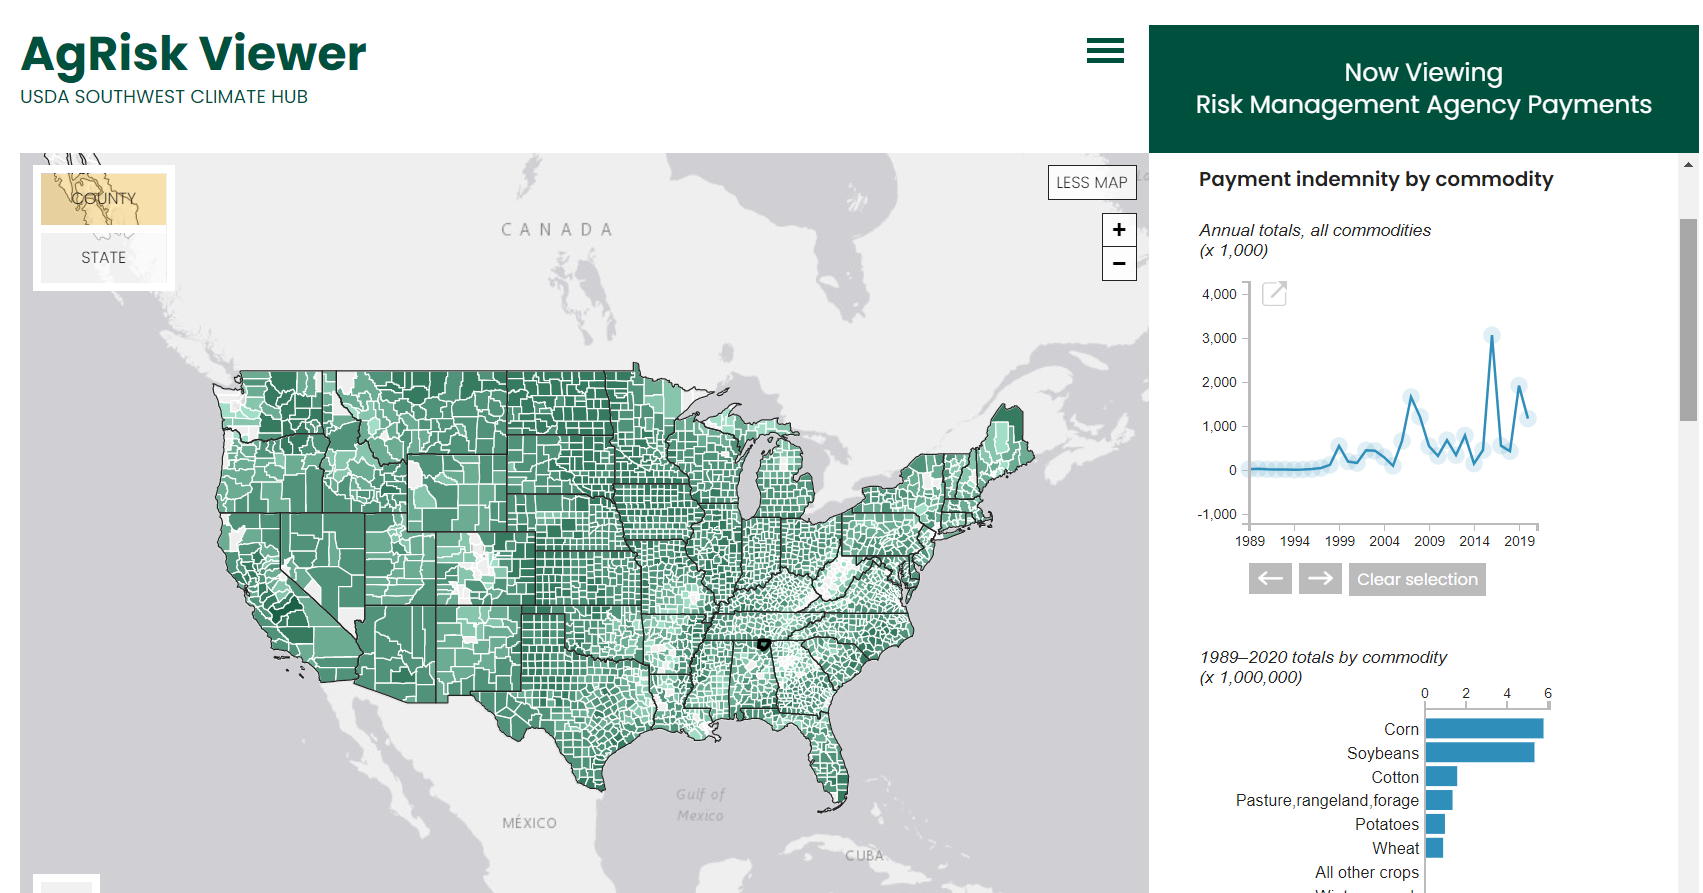
Here’s a tool that you might find useful. The USDA Southwest Climate Hub has an interactive viewer that allows you to look at financial losses due to climate for every county in the United States. You can read more about it at https://www.climatehubs.usda.gov/hubs/southwest/tools/agrisk-viewer or go right to the viewer at https://swclimatehub.info/rma/rma-data-viewer.html. I encourage you to…
-
The Federal Government recently announced the launch of a new website related to mapping hazards and improving community resilience. The Climate Mapping for Resilience and Adaptation (CMRA) website at https://resilience.climate.gov/ integrates information from across the federal government to help people consider their local exposure to climate-related hazards. People working in community organizations or for local,…
Posted in: Tools for climate and agriculture -
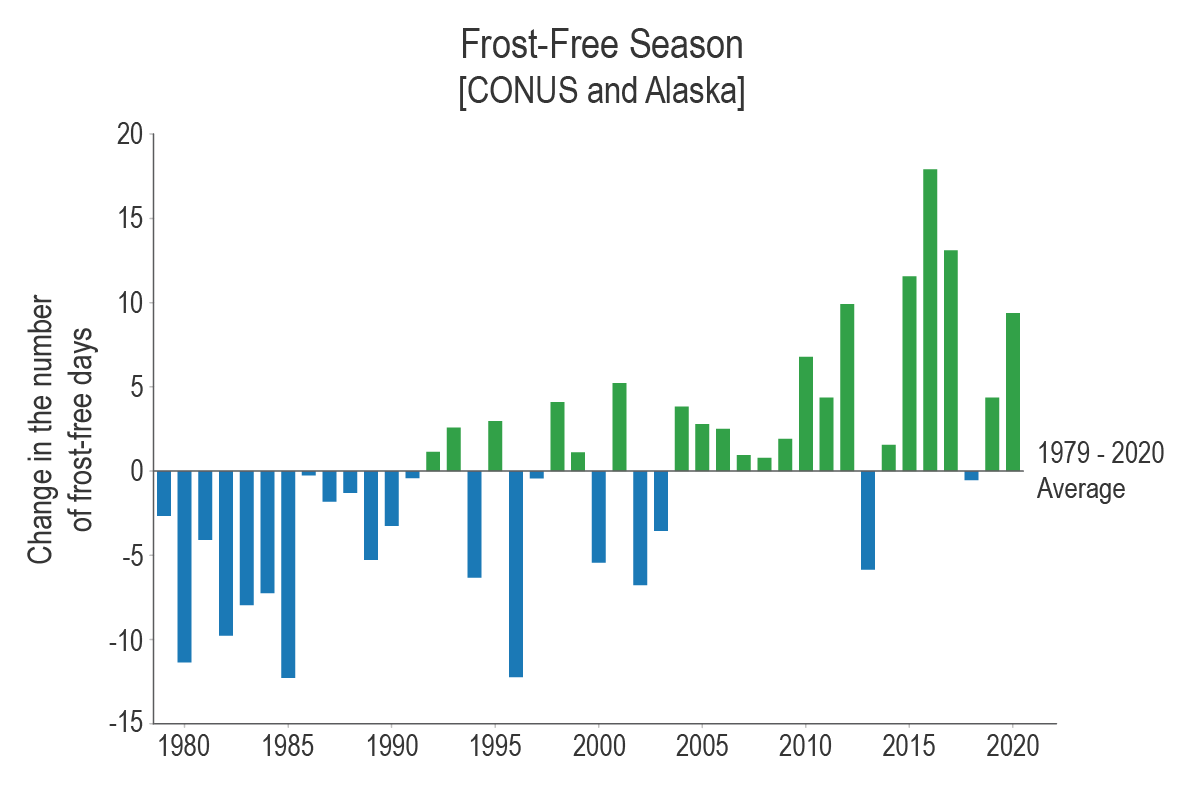
Indicators are observations or calculations that can be used to track conditions and trends. Indicators related to climate—which may be physical, ecological, or societal—can be used to understand how environmental conditions are changing, assess risks and vulnerabilities, and help inform resiliency and planning for climate impacts. The indicators listed include temperature, heating and cooling degree…