Tools for climate and agriculture
-
In this series on sources of climate and weather information, we’ve looked at the state climatologists and the National Climate Data Center (NCDC–now part of NCEI, the National Centers for Environmental Information) so far. In between these two levels of data sources are the regional climate centers, also part of NOAA. The map of regional…
-
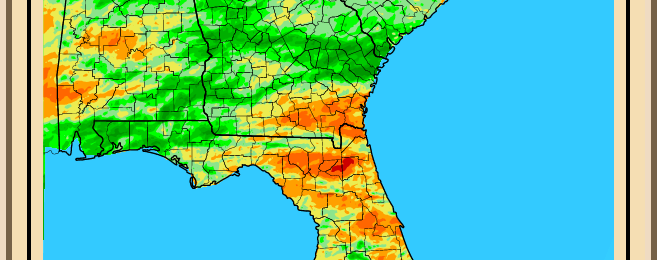
The Lawn and Garden Index map for the Southeast shows that in spite of significant rains in many areas of the region, there are still areas that need water, either in the form of rain or irrigation. This map, which is produced by the Alabama State Climatologist, shows the capacity of current soil moisture conditions…
-

The preliminary statistics for April are coming in and show that most of the Southeast was much warmer than usual. The HPRCC climate maps from the High Plains Regional Climate Center below show that most of the area had temperatures of 2-4 degrees above average in the Carolinas , 4-6 degrees above average in Georgia…
-
Monitoring the weather for planning or safety when severe conditions threaten can be a full-time job if you don’t know where to look. The Vane posted an excellent article which describes some of the best apps and web sites for tracking weather at https://thevane.gawker.com/here-are-the-best-websites-and-apps-you-can-use-to-trac-1698292812. Maybe you use some of these already. If there are others you…
-

In the last week I’ve received 5.94 inches of rain in my gauge near Athens. Many areas of the Southeast received more than ample rain in the last few days. Fortunately, it looks like we may have a dry spell mid-week to cheer us up and help the farmers catch up on their field work.…
-

Has all the rain this week caused problems with flooding? The National Flood Insurance Program has an online calculator that can show you the cost of a flood to your home at https://www.floodsmart.gov/floodsmart/pages/flooding_flood_risks/the_cost_of_flooding.jsp. The tool allows you to enter the size of your house and how deep a flood to consider and gives you an estimate…
Posted in: Tools for climate and agriculture -

The Southeast Regional Climate Center has a useful display tool for showing the rankings of observed temperature values at NWS stations around the Southeast. Today a number of stations in the region set record high temperatures and a few more set record high minimum temperatures. The tool also allows you to look two days ahead…