-
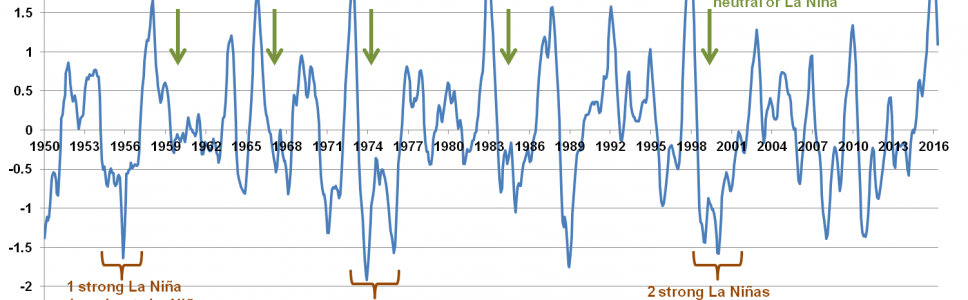
Dairy Herd Management has one of the best discussions I have seen about the end of the current El Niño and what is likely to happen with the coming La Niña. It’s written in a general way, not geared to livestock, so crop producers and foresters should read it too. Here’s the link. Unlike El…
Posted in: Climate and Ag in the news, Climate science, Crops, Drought, El Nino and La Nina, Livestock -
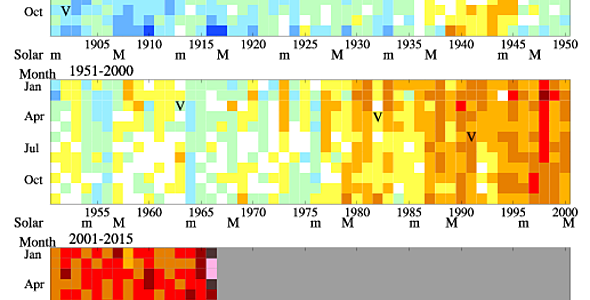
AccuWeather put together a nice summary of indicators of changing climate in their post today at https://www.accuweather.com/en/weather-blogs/climatechange/update-on-climate-change-indic/58459419. This article pulls together graphs of changes in Arctic and Antarctic sea ice, carbon dioxide measurements, and global temperature and presents them in a straightforward way with just a little commentary for context.
-
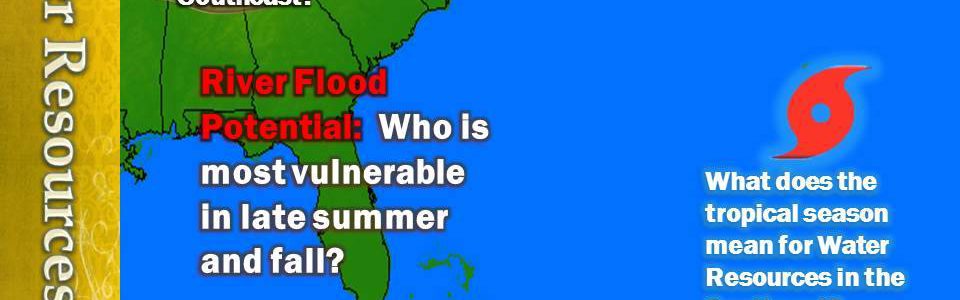
The latest Southeast River Forecast Center outlook for water resources in the Southeast is now available. You can find it at https://www.youtube.com/watch?v=6SAWny6QwQ0&feature=youtu.be.
-
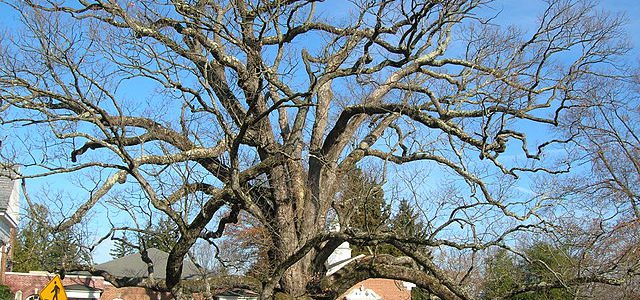
The Washington Post had an article this week about the “Holy Oak” located in Basking Ridge, NJ, which is estimated to be over 600 years old. It is the oldest white oak in the US and possibly the world. The tree is slowly dying, and the residents are mourning the loss of a tree with…
-
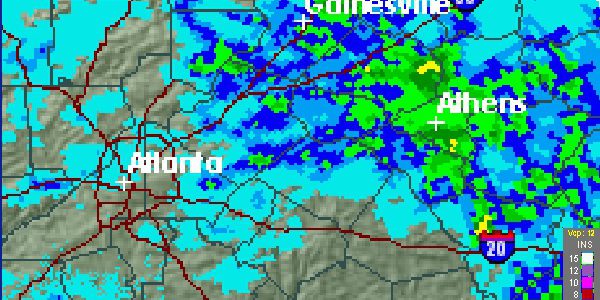
I am sitting here at my house listening to thunder roar and the rain pour down. Serves me right for talking about drought expanding this week! I want to show you from my own experience why networks like CoCoRaHS are so important. The map below shows the radar-estimated storm total rainfall from the NWS Peachtree…
-

Kansas AgLand posted a story today about the record wheat yields they are harvesting in parts of the Plains. Perfect rainfall and temperature conditions have combined to fill the bins with amazing amounts of wheat across a wide area. Even the less desirable strains in dryland fields are yielding excellent results. Unfortunately, the good yields…
-
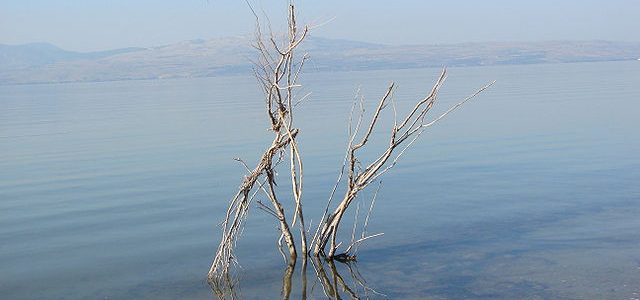
Haaretz.com posted a story this week describing the severe drought which has affected northern parts of Israel, resulting in nearly record low levels on the Sea of Galilee. The low amounts of precipitation over the last three years have dropped the lake levels precipitously, and if it drops another five feet they will have to…