-

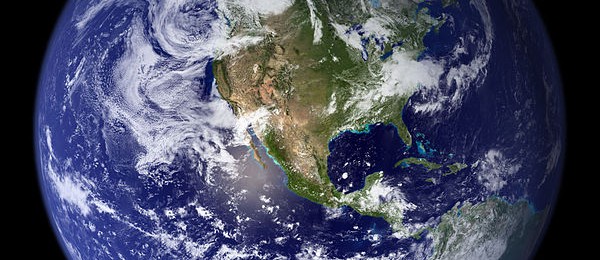
Here’s a great site for looking at historical climate as well as projections of future climate. It’s called the Climate Explorer and is part of the US Climate Resilience Toolkit. It allows you to search by location anywhere in the contiguous US or by variable, including temperature, precipitation, and degree days and provides projections out…
-
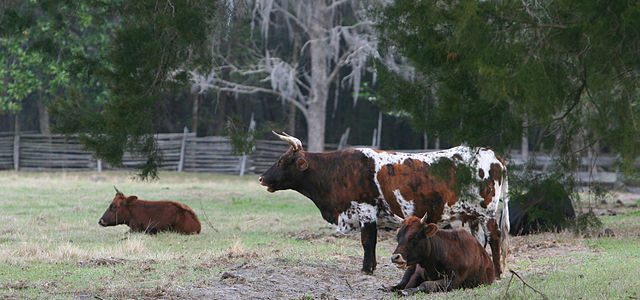
Depending on where you live, the animal feed in your area could be affected by either drought (as in Texas or Europe) or soggy conditions (most of the Southeast). Here are a few articles I have seen discussing how the weather is impacting animal feed recently. Also note the story about the loss of pork…
-
AgWeb posted a story this week on the results of a new study by University of Colorado scientists which looked at whether people of different political parties agreed or differed in their beliefs on global warming. They found that “Sixty-six percent of Republicans, 74 percent of Independents, and 90 percent of Democrats said they believed…
-
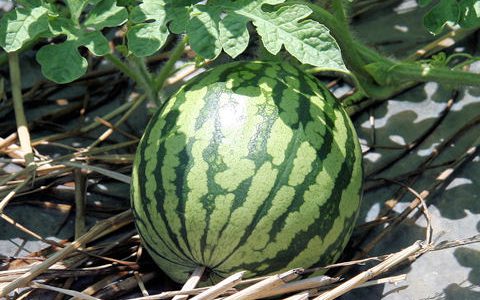
Vegetable and Specialty Crop News posted a story this week on how all of the rain we have had in the Southeast is impacting the development of several diseases on watermelons and other plants. In spite of the moist conditions, most farmers have been warding off the worst diseases by active and repeated spraying of…
-

It is the time of year when football coaches start to get ready for the start of fall practice in anticipation of the coming football season. It’s also the time of year when heat and humidity can cause dangerous conditions for heat stress and heat stroke. Every year a few people die from practicing too…
-
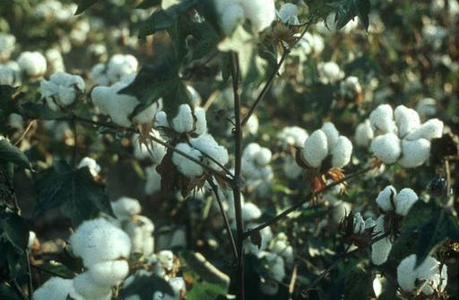
The Southeast Farm Press noted this week that cotton production in Alabama has not gone well this year due to the variety of unusual weather they have experienced. It started with cool temperatures in April that halted planting for almost a month. May was hot and dry, which further delayed planting. Now they have a…
-
The dry spell that has been plaguing the Carolinas for the last few weeks has impacted the tourism in the region. Specifically, water recreation like tubing in some of the rivers in the western NC mountains has been cut back by flows that are too low to run safely. You can learn more at https://www.wfmynews2.com/article/news/local/rain-rain-come-our-way-weather-affects-dan-river-tubing/83-575843243. Fortunately,…
Posted in: Climate and Ag in the news