-
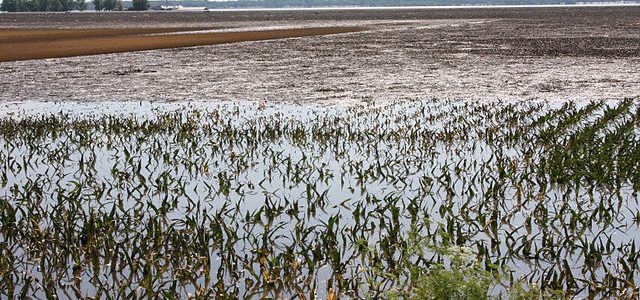
Here is an interesting column published this week in AgWeb which discusses how this year’s crazy weather will impact farmers and their management choices in future years. Farmers will no longer be able to just do “business as usual” as far as planning for planting goes, and will need to consider using cover crops and…
-
The latest forecasts for northern Georgia and surrounding areas show that scattered showers similar to what we are seeing today are expected to continue across the region for most of the next two weeks. These summer storms are very typical for late summer and because they are so scattered, getting rain from them (or conversely,…
Posted in: Climate outlooks -
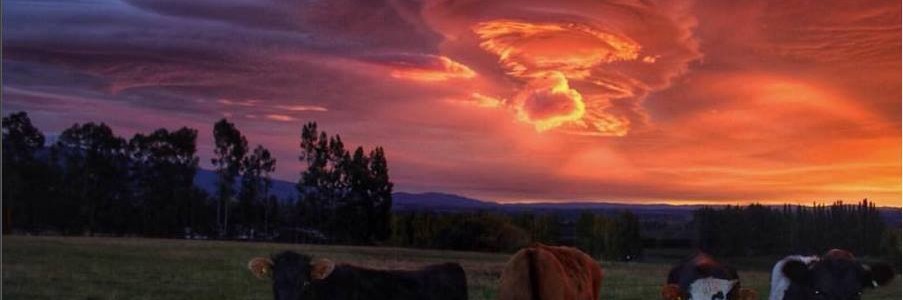
The Cloud Appreciation Society (https://cloudappreciationsociety.org/)is one of my favorite sites for viewing spectacular images of clouds. Here is a great story from Reuters about the society and how our views of clouds are changing our views of how the climate is changing. Clouds are one of the most important and not well understood influences on…
-
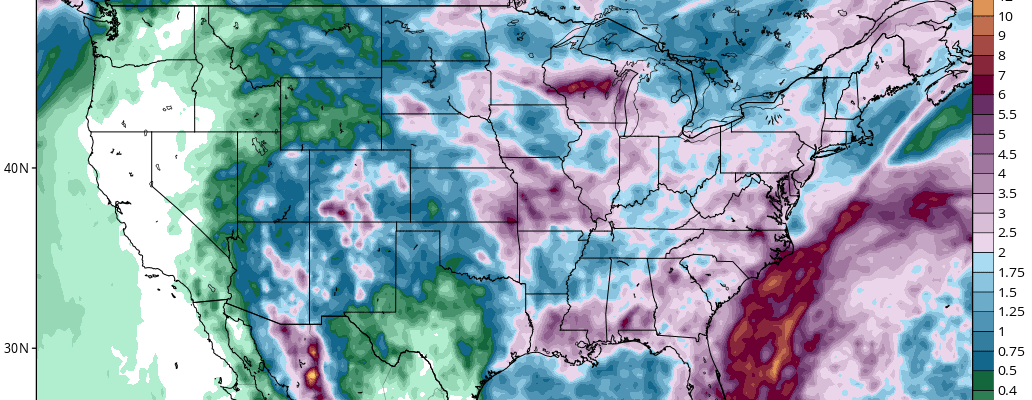
The latest 7-day QPF map shows little rain in the next week for most of the Southeast with the exception of the Florida peninsula and some of eastern NC. Most of whatever rain does fall in the region will be late in the week on Thursday and Friday. Temperatures will be rising from the cool…
Posted in: Climate outlooks -
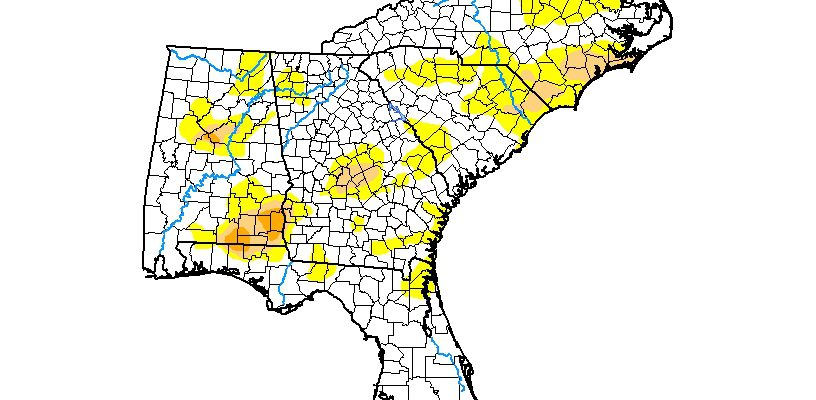
The latest Drought Monitor, released this morning, shows only small changes to the drought across the Southeast this week. The biggest change is a slight expansion of severe drought in Alabama, while the D2 drought is almost entirely gone from Georgia now. Most of the region will be fairly dry in the next week except…
Posted in: Drought -

Plan G is a new initiative by television station 11 Alive in Atlanta to talk about how Georgians are reacting to changes in the climate that they see all around them. Here is a great 20-minute video showing people from around the state with various thoughts about climate change and how the state is working…
-
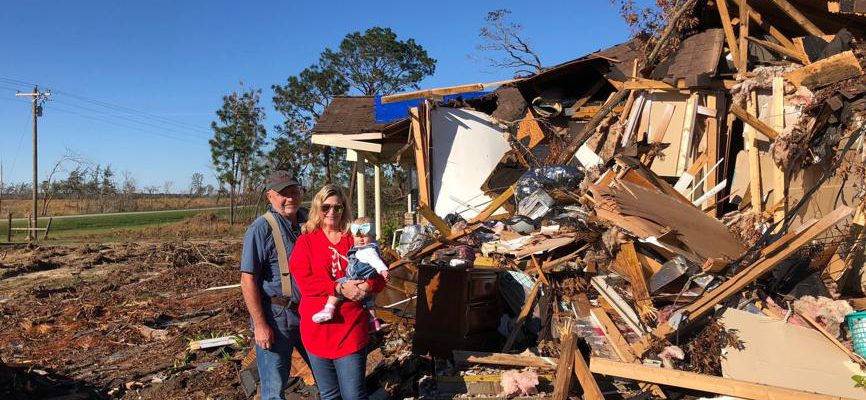
While I hope that it’s a long time before another weather (or other) disaster hits anyone in the Southeast, any good steward knows that it is important to be prepared just in case. Here is a good short article which describes some of the steps you can take to make sure that if something bad…
Posted in: Climate and Ag in the news