Tools for climate and agriculture
-

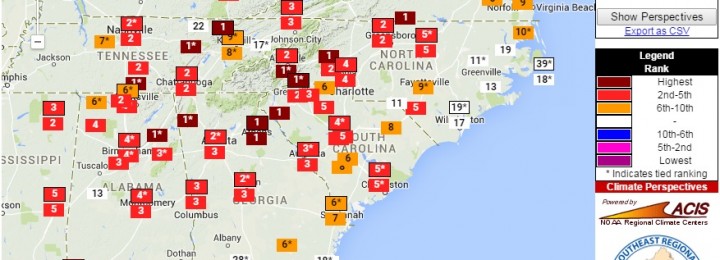
The Southeast Regional Climate Center provided a map of the ranking of monthly precipitation anomalies for selected stations in the Southeast using their Perspectives tool this week. The map is shown below. It shows that at numerous stations around the Southeast, the monthly total precipitation in March 2015 was ranked in the top ten driest,…
-

The Climate Prediction Applications Science Workshop presentations from last week’s meeting in New Mexico are now available as PDF files online. You can see the agenda and link to the presentations at https://aces.nmsu.edu/cpasw/presentations.html. If there is not a PDF available it is because the author did not want it published. Lots of good information there on…
-

The National Weather Service has a new experimental product available which provides 6-day forecasts of evapotranspiration in a zoomable map format. A weekly total is also available. You can access this product at https://preview.weather.gov/graphical/. You can find the FRET daily values by looking under Agriculture at the bottom of the product pull-down menu on the top…
-

At CPASW today we learned that the Climate Prediction Center is in the process of updating their website to a new, cleaner and more interactive model. You can view the new beta version of the website at https://www.cpcpara.ncep.noaa.gov/. This site will combine much of the functionality of the old web site, including climate and drought outlooks,…
-
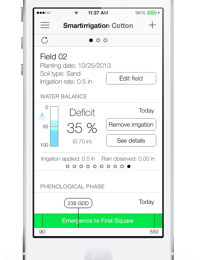
Dr. George Vellidis of the University of Georgia and cooperating scientists at several other Southeastern universities have developed several irrigation applications for smartphones as part of their work on the USDA NIFA program. Currently apps are available for cotton, citrus, strawberries and urban lawns. You can learn about these apps and download them at https://smartirrigationapps.org.…
-
I am attending the Climate Prediction Applications Science Workshop this week in Las Cruces NM. The theme of this year’s meeting is agriculture. After one day, my mind is already full of new web sites to visit and tools that might be useful to those of us who use climate information to make production decisions.…
-
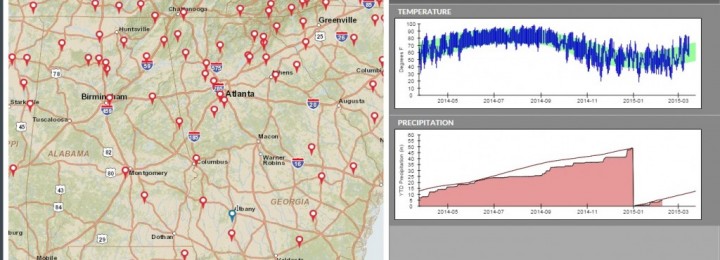
The beautiful weather yesterday set records across many parts of the Southeast. If you are interested in looking at the temperatures or rankings for yourself, the Southeast Regional Climate Center has a good tool called “Perspectives” which allows you to look at the recorded values of recent weather conditions and calculate the ranking of that…