Pam Knox
-

The latest Drought Monitor, released today, shows that all drought conditions have been removed from the Southeast mainland but a few pockets of abnormally dry (D0) conditions are still lingering. In Puerto Rico, the drought conditions there have shrunk but a few small areas remain. With the recent rain, we are likely to see further…
Posted in: Drought -

I am in Austin TX for the eclipse on Monday, but I don’t expect to see much, since rain is expected to move in on Monday morning. But I am hopeful that we may get a break in the clouds. If nothing else, it will get really dark for a few minutes. That rain will…
Posted in: Climate outlooks -

The first official hurricane forecast for the 2024 Atlantic hurricane season was released today by researchers at Colorado State University. The forecast shows that they expect 23 named storms this season due to a combination of La Nina and very warm ocean temperatures. You can read the details of how they produce the forecast at…
-

The March 2024 monthly climate summary for North Carolina was posted today. It shows that conditions across the state were generally warmer and wetter than normal. You can read more in their climate blog at https://climate.ncsu.edu/blog/2024/04/rain-returns-and-pollen-proliferates-in-a-warm-march/.
Posted in: Climate summaries -

The latest Drought Monitor, released today, shows that the area of abnormally dry (D0) conditions in eastern North Carolina decreased slightly this week due to rainfall. The area of moderate (D1) drought there did not change. The small area of abnormally dry conditions near Tampa FL also did not change this week and the drought…
Posted in: Drought -

Although we don’t have the final numbers in yet, March 2024 looks like it was wetter and warmer than normal across nearly all of the region. Overnight low temperatures were more above average than the daily maximum temperatures, a trend we are seeing in most months and seasons across the Southeast (and many other parts…
Posted in: Climate summaries -
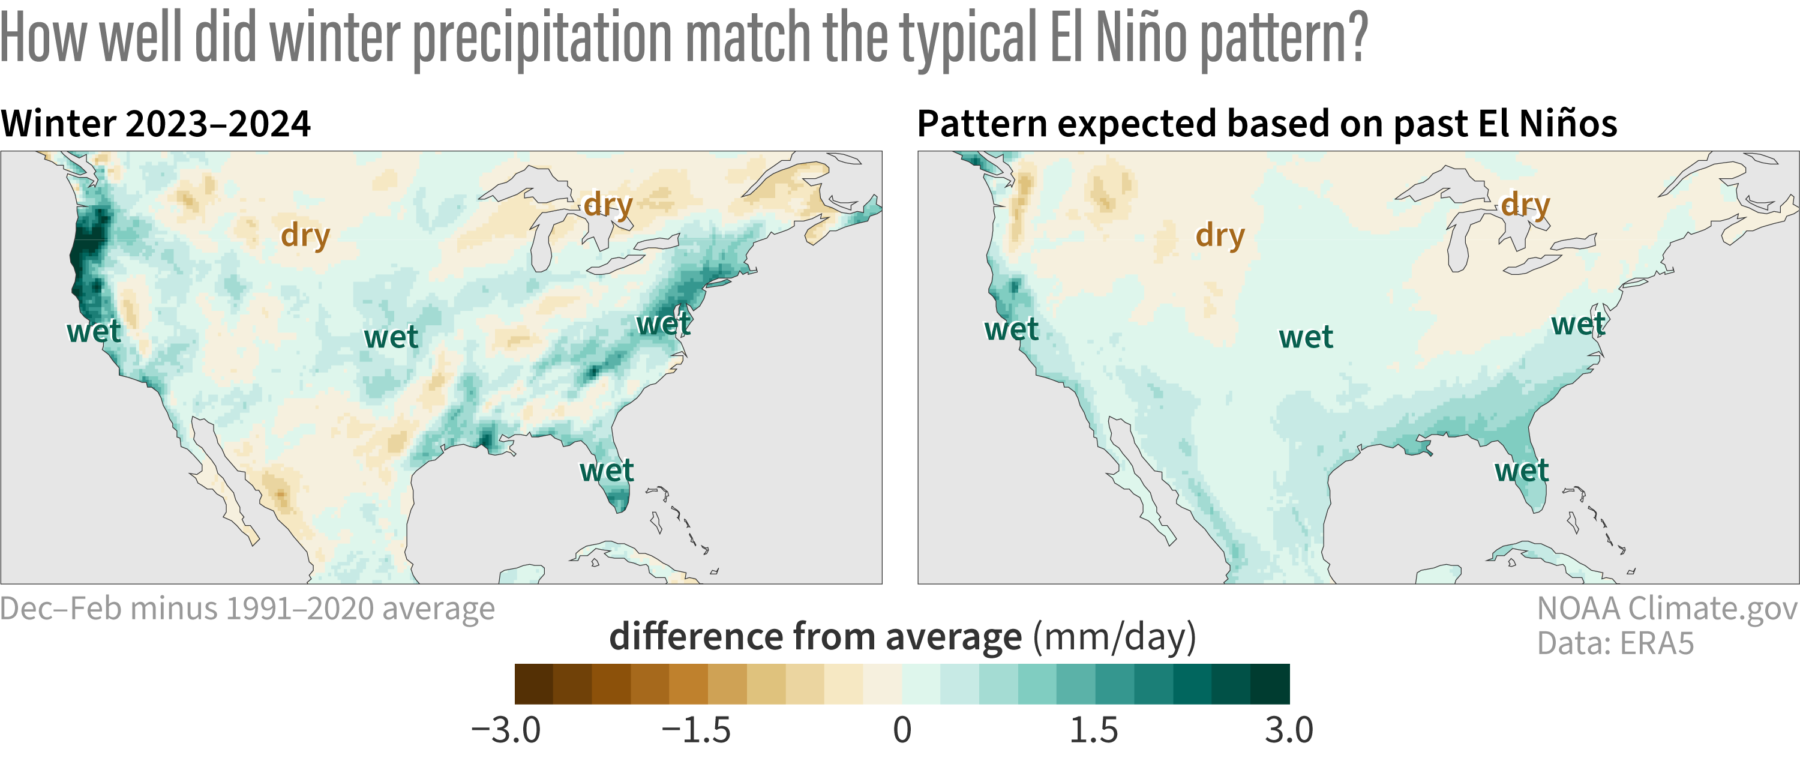
As expected, for us in the Southeast, rainfall this winter has been abundant for most of the winter due to the effects of the current strong El Nino (maybe a little too abundant for some farmers). But how does the amount of rainfall we got compare to what we usually get in El Nino winters?…