A website from UGA Cooperative Extension

Food, Agriculture, and Resource Economics

Recent Posts

  • Every five years the USDA conducts an agricultural census in order to better understand changes in the agricultural landscape. The latest release occurred in mid-February 2024 and provided a glimpse into the landscape of agriculture throughout the U.S.

    With respect to Georgia, the market value of agricultural products increased by 16% to over $13 billion. Georgia ranked second in the Southeast in market value of products sold behind North Carolina. However, the number of farms decreased by 7% from 2017 to 2022 with just under 40,000 farms in Georgia. The amount of acreage remained relatively the same, but average farm size increased from 235 to 253 acres (or an 8% increase). The largest losses in farm numbers came at the 1-9 acre level (decreased by 26%) while 2,000+ acre farm numbers increased by 22%.

    Georgia farms also saw changes in the legal structure of farms. The number of family/individual and partnerships decreased by 9% and 7%, respectively. However, farms as corporations increased by 18%.

    Examining individual Georgia agricultural sectors, Georgia experienced the following with respect to market value of crops sold:
    -Nursery, greenhouse, floriculture, sod increased by 15% to $441 million
    -Poultry and eggs increased by 22% to $7.9 billion
    -Cattle and calves decreased by 12% to $380 million
    -Cotton increased by 39% to $1.2 billion
    -Vegetables, melons, potatoes, increased by 1% to $681 million
    -Fruits, tree nuts, and berries decreased by 3% to $486 million

    Comparing Georgia to other Southeastern states, Georgia fared better is the smallest decrease in the number of farms and having a stable farm acreage compared to many Southeastern states that had a large number of acres moving out of agriculture.

    For more detailed information, please visit the following links for more detailed factsheets regarding Georgia agricultural and the latest agricultural census.

    Georgia agricultural factsheet

    Southeastern agricultural comparison factsheet

    For more detailed information about our extension and research efforts, please visit the UGA Department of Agricultural and Applied Economics extension page:
    https://agecon.uga.edu/extension.html

    Ben Campbell
    Associate Professor
    Department of Agricultural and Applied Economics
    University of Georgia
    ben.campbell@uga.edu
    706-542-0852

    Posted in:
  • All sectors of Georgia’s food and fiber industry have been impacted by the COVID pandemic. In May, over 850 producers completed a survey describing the early impacts of the disease on agriculture in Georgia. In an effort to get a more complete story for 2020, the Georgia Foundation for Agriculture, Georgia Farm Bureau, the Center for Agribusiness and Economic Development are jointly offering a follow-up survey.

    If you are an agricultural producer located in the state of Georgia, please take the time to complete this 10-minute survey. As an industry, it is critical that we work together to document the needs of our farming community during this time.

    Thank you very much for your participation and please, click on the link to take the survey:

    Georgia Farmers Year-End COVID-19 Impact

    If the link above doesn’t work, please copy paste the following in your browser: 

    https://ugeorgia.ca1.qualtrics.com/jfe/form/SV_efBzrDOnqssorRP

    If you have any questions about the survey, please feel free to contact the Center for Agribusiness and Economic Development, University of Georgia, Vanessa P. Shonkwiler at 706-542-9811  or V.Shonkwiler@uga.edu.

    Posted in:
  • Esendugue Greg Fonsah1 and Justin Shealey2

     1Professor and REI Coordinator, Department of Agricultural & Applied Economics

    University of Georgia, Tifton, GA 31793

    And

    2County Extension Coordinator, Echols County, University of Georgia

    Click Here to download a PDF version of file

    Despite the dynamism of the Georgia fruits, vegetable and tree nuts industry, this over $2 billion industry has embraced several difficult times in the past almost two decades.  Let us start with the Montreal Protocol that recommended a complete eradication of Methyl Bromide because of its toxicity to the ozone layer.  Then came the Salmonella Saint Paul that affected 43 states and 1,401 people infested nationwide.  Then the Thrips and Tomato Spotted Wilt Virus (TSWV) showed up; then the Tomato Yellow Leave Curl Virus (TYLCV), then the 2017 frost that devastated over 50% of Georgia blueberries; then the 2018 Hurricane Michael devastated both specialty and row crops in South Georgia, including pecans.  Still in 2018 and 2019, it was the tariff war between the U.S. and China and trade war between the U.S., Mexico and Canada, which ended up abolishing the North American Free Trade Agreement (NAFTA) that was created in 1994 and created the new United States, Mexico, Canada Agreement (USMCA) on September 30, 2018.  Today, it is the Coronavirus also known as COVID-19.  The difference between Covid-19 and the other reported incidences is that, while the others affected the specialty crop industry directly, the COVID-19 will indirectly affect the entire industry.  Why? Because the COVID-19 is an airborne communicable disease and highly contagious virus that affects and causes death to human beings.  Ever since COVID-19  became a pandemic, most countries including the United States have shut down their borders, Embassies and imposed travel restrictions. 

    Agriculture is the backbone of the state of Georgia and its economy with a farm gate value of about $14 billion.  Most fruits (blueberries, strawberries, peaches, Muscadine grapes, satsuma citrus), and vegetables (pepper, squash, eggplant, cucumber, watermelon, sweet corn, greens, onions, carrots) etc., in Georgia are all handpicked, thus the need for seasonal, migrant and/or immigrant labor.  These fruits and vegetables are currently getting mature in the fields in Georgia, the Southeast regions and other parts of the country.  In other words, they are getting ready for harvesting and marketing.  The announcement that the U.S. Embassy in Mexico will stop interviews of seasonal workers has sent another wave of panic to the existing COVID-19 pandemic fear.  Common sense tells us that if this happens, chances are that there will be huge labor shortages, not only for Georgians, the Southeast region, but the entire country, especially if the decision is not reversed or relaxed in a timely manner. 

    In article 9112-FP from the Department of Homeland Security, U.S. Customs and Border Protection, 19CFR Chapter 1 entitled “Notification of Temporary Travel Restrictions Applicable to Land Ports of Entry and Ferries Service between the United States and Mexico” that went into effect at 11:59 p.m. (EDT) on March 20, 2020, clearly stated that this restriction will be observed until 11:59 p.m. EDT on April 20, 2020.

    A shortage of migrant and/or immigrant seasonal workers caused by coronavirus will result into the following:

    1.       Huge field crop loss for some handpicked fruits and vegetables as some growers may not have enough seasonal or permanent labor force to harvest their crops.

    2.       Despite the anticipated seasonal and permanent worker shortages, the recommended social distancing for safety reasons will also delay the harvesting process and increase the loss incurred since these are mostly perishable food crops

    3.       If this happens, Georgia may lose over $billion if hypothetically, only 50% of its specialty crops are harvested.  Nationwide, the entire fresh food industry may lose $billions in crop loss given the scenario describe above.

    4.       Although the U.S. exports significant amount of specialty crop to Mexico and Canada, the U.S. also imports more from these two countries than we sell to them.  Thus, if the Covid-19 pandemic results in shutting down the boarders and restricting visas to migrant labor, that would deprive entry of the badly need fresh imported food from Mexico and Canada to subsidize the insufficient U.S. domestic production.  That would further exacerbate the expected shortage caused by the lack of seasonal workers to handpick U.S. grown crops.

    5.       The huge shortage of both domestic and imported food would affect the entire fresh food value, supply chain, and result in a nationwide food crisis.

    6.       Furthermore, it would exponentially spike prices of the existing limited domestic quantity.

    7.       The lack of seasonal and/or permanent labor force needed for harvesting might put enormous financial pressure on our hardworking growers and might put some out of business without any form of government assistance1.

    1Secretary Pompeo, in consultation with the Department of Homeland Security, has just relaxed the H-2A policy by waiving interviews to seasonal migrant workers whose visas expired 48 month ago including those who never had an H-2 visa.   The relaxed policy is aimed at mitigating the foreseen problems vis-à-vis Covid-19, seasonal workers and national food supply shortages and, eventual price hike.  

    For more information, contact the Georgia Extension Vegetable Team:

    Esendugue Greg Fonsah, Professor, REI Coordinator and Extension Agribusiness Economist, Fruits, Vegetables and Pecans, University of Georgia, Tifton, GA 31793; gfonsah@uga.edu Tel: 229-386-3512

    Justin Shealey, County Extension Coordinator, Echols County, 109 Courthouse Street, Statenville, GA, 31648, University of Georgia, Email: justin1@uga.edu, Tel: 229-559-5562

    Posted in:
  • By: Esendugue Greg Fonsah1, Brian Hayes2, Will Gay3, Ty Torrance5, Justin Shealey5

    1Department of Agriculture and Applied Economics, University of Georgia, Tifton, GA, 2-5Michel Co., Colquitt Co., Grady Co., and Echols County Extension Coordinators, University of Georgia.

    Click Here to download a PDF version of file

    In Georgia, vegetables are grown using either the plasticulture system and/or on bare-ground. Hurricane Michael affected both cultural practices.  This study focuses on the cost of bare-ground production system damage by the Hurricane.  Our calculations are based on the recommendation of the Extension Vegetable Team, Vegetable Growers and County Agents in South Georgia (Table 1).

    Although plasticulture has several advantages, which include higher yields, the system is much more expensive. As a result, many Georgia Growers still use bare-ground production system, which accounts for approximately 64%, equivalent to 38,000 acres of the vegetable production damaged by Hurricane Michael.  Sweet corn was the largest acreage crop at approximately 15,000 acres. Producers using bare-ground production system experienced crops (particularly corn, snap beans, fresh pick, etc.) being laid over, excessive wash-out from rain of rows and field lay-out (roadways, access roads, etc.), and loss of residual fertilizer and soil fumigant. Additionally, land preparation was needed to recover fields for future planting.


    Table 1: Analysis of the Estimated Costs of Bare-Ground Production Loss Due to Hurricane Michael in South Georgia, 2018.

    Description $-Total/Ac
    Land structure recovery from Hurricane Michael damage1 
    Tractor/driver/equipment – $17.76/A x 2 passes $     35.52
    Land prep including mowing and harrowing under damaged plants
    Tractor driver @ $15.53/hr. – ½ hr./A x 3 passes2 $ 23.30
    Tractor/fuel @ $10/A   x 3 passes $   30.00
    Lime – ½ T/A – $36.50/A for soil fertility adjustments $   18.25
    Fertilizer – 450 lb./A – $600/ton ($.30/lb.) 3 $ 135.00
    Fumigant – 8 gal./A – $ 20/gal. 4 $   160.00
    Cover crop to prevent erosion damage
    Seed for cover crop – $20/A $ 20.00
    Fertilizer for cover crop – $40/A $ 40.00
    Planting – tractor/driver/fuel – $17.76/A $ 17.76
    Total Bare-ground Production Loss5 $ 479.83

    1Land preparation – leveling/rows/roads, etc. 2#hrs/acre depends on the size and/or HP of the tractor. 31.5 x normal rate due to leaching loss. 41.25 x normal rate due to leaching loss & pest pressure. 5These figures are guidelines as growers adopt different agricultural practices and obtain different prices for inputs.

    To recover from the damage caused by Hurricane Michael, the following agricultural practices were needed: (a). Land preparation due to unharvested crop, (b) plant material to prevent spread of insect and disease field wash-out, and; (c). replacement of fertilizer/fumigant lost through leaching.  In many cases, a cover crop was required to prevent soil erosion by water or wind.  Table 1 below is an estimated breakdown economic analysis itemizing the operational recovery cost per acre for bare-ground field production damaged by Hurricane Michael.

    The total cost of bare-ground production loss due to the October 10, 2018 Hurricane Michael damage in South Georgia is estimated at $479.83/acre (Table 1).

    If you have further questions or need any clarification, by all means, do not hesitate to contact us via email: gfonsah@uga.edu; hayesbw@uga.edu; torrance@uga.edu; wgay5@uga.edu; bstarr@uga.edu; or justin1@uga.edu

    Posted in:
  • By:  Esendugue Greg Fonsah1 and Justin Shealey2

    1Department of Agriculture and Applied Economics, University of Georgia, Tifton, GA, 2Echols County Extension Coordinator, University of Georgia, Statenville, GA.

    Click Here to download a PDF version of file

    After the damage caused by Hurricane Michael on October 10, 2018 for which the Georgia Vegetable industry suffered a total loss of $480 million, we decided to calculate the estimated cost/Acre of removing and replacing destroyed plastic mulch, by growers. Our calculations are based on the recommendation of the Extension Vegetable Team, information gathered from Vegetable Growers and County Agents during our multiple visits of vegetable farms in South Georgia to collect data needed to generate 2020 vegetable budgets for the state of Georgia (Table 1).

    Georgia vegetables are grown either in a system called ‘plasti-culture’ or on ‘bare-ground’. There are many advantages of plasti-culture production including higher yields, but it is much more expensive than ‘bare-ground’ production.  For growers using plasti-culture, a planting bed approximately 12 inches high and 3-4 feet wide covered with plastic is required.  Beneath the plastic, drip lines are run for irrigation, fertilization and pesticide applications.  In addition, during the process of laying the plastic mulch, the bed is fumigated for soil borne diseases and weed seeds and/or weed control.

    It is important to note that Growers normally use the plastic bed for 3-4 crops before having to reshape and re-fumigate the beds, re-place the plastic and drip lines. In many cases and during our visit and assessment, Hurricane Michael damaged or destroyed the beds and plastic, requiring re-

    laying of plastic, drip lines and fumigation. Table 1 below is a simplified breakdown economic analysis itemizing the operational recovery cost per acre for possible replacement of field production, plasti-culture damaged by Hurricane Michael.

    Table 1: Analysis of the $-Value of Replacing Plastic Mulch Loss Due to Hurricane Michael    

                   to the South Georgia Vegetable Industry, 2018

    Description$-Total/Ac
    Removal of plant material, plastic mulch, stakes and disposal at land fill. 
    Removal of plastic – 4 workers @ $14.53/hr. – 2 hr./A$ 116.24
    Removal of drip tape – 2 workers @ $14.53/hr. -1 hr./A$     29.00
    Removal of stakes – 6 workers @ $14.53/hr. – 1 hr./A$     87.18
    Removal of string – 4 workers @ $14.53/hr. – 1 hr./A1$     58.12
    Mowing old plants – 1 worker @ 14.53/hr. – 1 hr./A$     14.53
    Plus fuel$       9.60
    Disposal at landfill –$     50.00
                                     Total of Planting Material Removal$ 364.67
      
    Laying new plastic, land prep, materials, fertilization, fumigation, labor. 
    Land prep – tractor/driver/fuel – 3 tractors – $10/A$     30.00
    Fertilizer – 300 lb./A – $600/ton ($.30/lb.)$     90.00
    Fumigant – 135 lb./A – $4.40/lb.$   594.00
    Plastic – 8,712 ft./A – $0.055/ft.2$   479.16
    Tape – 8,712 ft./A – $ 0.014/ft.$   125.84
    Tractor & Equipment to Lay plastic$   150.00
    Labor – Fumigation/Fertilization/plastic laying: 10 workers @ $14.53/hr. – 1 hr./A$   145.30
    Irrigation Hookup – 2 workers @ $14.53/hr. – 2 hr./A$     58.12
    Stakes – 2200/A – $0.25/stake$   550.00
    Labor to install stakes – 12 workers @ $14.53 – 1 hr./A$   174.36
    Total Laying New Plastic, land-prep, material, fertilization, fumigation, labor$ 2,396.78
                                                       Grand Total Costs3$2,761.45


    ========

    1Cost of strings are not included because that is a cost for the new crop and in normal operations, the string is lost.

    2Plastic costs will be higher for tomato growers because they would need silver mulch to control White fly instead of using black mulch.

    3The Grand Total Cost does not include interest rate of 6.5% used in the enterprise budgets.

    The total $-value for replacing plastic mulch loss due to Hurricane Michael to the South Georgia Vegetable Industry, 2018 is estimated at $2,761.45 (Table 1).

    If you have further questions or need any clarification, by all means, do not hesitate to contact us via phone 229-386-3512 or 229-559-5562 office or email: gfonsah@uga.edu or justin1@uga.edu

    Posted in:
  • 2019 Cotton Outlook

    By Yangxuan Liu

    Click to download the PDF version of this post.

    In 2019, Georgia’s farmers planted 1.4 million acres of cotton, which is the third-highest planted acreage for the past decade, down 30 thousand acres from 2018. The average cotton yield is forecast at 932 pounds per acre. Production is forecast at 2.7 million bales, which would be the second-highest on record. There are three major contributing factors to the increase in cotton acres in Georgia in recent years. First, the high cotton price in 2018 encourages more cotton production for 2019. Second, the declining in commodity prices due to trade tension with China makes cotton more competitive with other row crops. Third, the Bipartisan Budget Act of 2018 authorized seed cotton as a covered commodity and eliminated generic base and thus the eligibility for payments when planting other covered commodities on farms, such as peanut, with generic base.

    U.S. upland cotton planted acreage is 13.5 million, down 319 thousand acres from 2018, but it is still the third-highest for the past decade. The 2019 U.S. upland cotton is forecast at 21.1 million bales, which is the highest on record since 2005, up 3.6 million bales from 2018. During the years with large production, U.S. cotton exports are expected to increase. However, exports to China as expected are down, and additional Chinese tariffs on U.S. cotton make U.S. cotton less competitive in the Chinese market. Exports are currently forecasted to be 16.5 million bales for the 2019 – 2020 crop year, which would be the second-highest on record after 2005 at 17.7 million bales. The U.S. ending stocks for the 2019 – 2020 crop year are expected to increase to 7.2 million bales, which is the highest ending stocks for the past decade. The increase in supply due to increasing production and ending stocks in the U.S. creates downward pressure on U.S. cotton prices.

    The world cotton production is currently forecast at 124.9 million bales, which is the highest in history. World cotton use or demand has improved in recent years but the upward trend slows down for the past two years due to the uncertainty of the global economy and trade. The current world cotton consumption is forecast at 121.7 million bales. Expanding world supplies over demand has increased the global stock-to-use ratio, which is often accompanied by a fall in global cotton prices.

    Several other issues make cotton profitability challenging. In Georgia, the cotton basis since the implementation of Chinese tariffs has been lower than in previous years due to the smaller shipments to China. Before the tariff on cotton was implemented, China made purchases in large quantities, and often large shipments were sent to the same destination. However, after the tariffs on cotton were implemented, the large shipments to China were replaced by smaller shipments to other importers. The change in the size of the shipments has increased transaction costs for merchants and reduced the local basis for cotton. The other issue here is that China accounts for about 40% of apparel imported by the United States, of which 30% is made of cotton. The 25% U.S. tariff on Chinese apparel makes it more expensive for U.S. consumers to buy cotton apparel, which reduces the demand for apparel. Moreover, the appreciation of the U.S. dollar relative to other currencies makes our agricultural products more expensive in the export market and result in a reduction of prices.

    Futures prices (Dec 19) for the 2019 crop are currently at or around 61 cents per pound. The cash prices for the current calendar year of 2019 ranges from low of 54.41 to high of 74.46 cents per pound. USDA forecasts the marketing year average price for the 2019 – 2020 crop year at 58 cents per pound, compared to the 2018 – 2019 crop year average of 70.5 cents per pound.

    Posted in:
  • by Adam N. Rabinowitz and Walter Scott Monfort

    Click to download a PDF version of this publication.

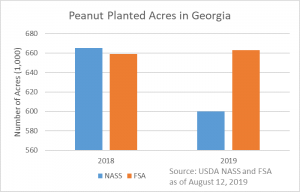
    The United States Department of Agriculture (USDA) National Agricultural Statistics Service (NASS) released their Crop Production report on August 12, 2019. Their report forecasts 2019 harvested acres in Georgia at 590,000, down from 650,000 in 2018. The basis for this forecast comes from the Crop Acreage report on June 28, 2019 and a survey of plantings and planting intentions from early June. The NASS reported 2019 Georgia acres are 600,000 for peanuts. If in fact, 600,000 acres of peanuts were planted in 2019 in Georgia, this would represent a 10% decline from 2018 when 665,000 acres were planted. While initial forecasts are prone to error and actual behavior may differ from plantings, the current NASS estimates are substantially lower than what is seen in other available data. This has substantial implications for expected marketing for farmers as there are likely more peanut acres in Georgia headed to market this harvest than what is currently forecast by the USDA NASS.

    The USDA Farm Service Agency (FSA) also reports acreage data based on producer self-reporting for participation in government programs including the Price Loss Coverage, Marketing Assistance Loans and Market Facilitation Program (trade assistance). On August 12, 2019, FSA reported acreage data as of August 1, 2019. FSA reports 663,000 acres of peanuts in Georgia. Thus, one must ask which number is best representative of the current peanut situation.

    To help answer this question, let’s take a look back at prior years. In June of 2018, NASS reported 700,000 planted acres of peanuts. The August 2018 report indicated a forecast of 690,000 harvested acres. At the same time, FSA reported 657,000 planted acres with their first release of data in August 2018. Subsequently, FSA reported the final acreage for peanuts in 2018 was 659,000. Meanwhile, NASS ended with a planted acreage of 665,000. This discrepancy is rather common as NASS will update their forecasts and FSA will not include producers who do not report acreage since they do not participate in the government programs. Therefore, one expects FSA reported acres to be lower than actual planted acres and NASS estimates to improve throughout the season. Based on this reasoning, which is commonly seen during prior years, FSA acres would be expected to be lower than NASS acres. In other words, FSA acres can also be thought of as a minimum number of acres that were actually planted during a given year.

    So, for 2019, we are left with NASS reporting 600,000 planted acres and 590,000 harvested acres. While FSA is reporting 663,000 planted acres. It is highly likely that the FSA reported acreage is closer to reality and the NASS figures need to be revised upwards by more than 10%. If this holds true, we are looking at planted acres in 2019 that are very similar to the number planted in 2018. Furthermore, production estimates need to also consider about 63,000 additional acres of peanuts planted in Georgia. NASS has forecast yields for Georgia at 4,400 pounds per acre. We expect this may also be a little high at this time, although we will save the debate on yield forecasts for another time. If for now we assume the NASS yield estimates, then an additional 138,600 tons of peanuts should be expected to be available this fall. In other words, there would have been no change in production between 2018 and 2019 in Georgia. Given the continued high levels of peanut stocks, this is not going to help prices during the current growing season and any expectation of rising prices due to lower acreage in Georgia should be tempered.

    References:

    U.S. Department of Agriculture, National Agricultural Statistics Service, Crop Production, August 12, 2019.

    U.S. Department of Agriculture, National Agricultural Statistics Service, Acreage, June 28, 2019.

    U.S. Department of Agriculture, Farm Service Agency, Crop Acreage Data, August 12, 2019.

    Dr. Rabinowitz is an Assistant Professor and Extension Economist in the Department of Agricultural and Applied Economics at the University of Georgia. Dr. Monfort is an Associate Professor and Extension Peanut Agronomist in the Crop and Soil Sciences Department at the University of Georgia.

    Posted in: ,
  • by Adam N. Rabinowitz

    On July 25, 2019, the USDA announced the 2019 trade assistance payment rates for the Market Facilitation Program. We have published a policy brief that contains the following helpful information:

    • Details of the county based payment rate and potential maximum payments by county for non-specialty crops. Most notably for Georgia this includes producers of cotton, peanuts, corn, soybeans, and wheat.
    • Payment rates for specialty crop products (pecans), dairy, and hogs, including potential payments for each of these products produced in Georgia.
    • Program deadlines, eligibility, and payment limits.

    Our estimates are that GA agricultural producers may receive about $341 million in assistance to alleviate negative impacts from retaliatory tariffs.

    The full policy brief can be downloaded from the UGA Center for Agribusiness and Economic Development through this link:

    https://caed.uga.edu/content/dam/caes-subsite/caed/publications/center-reports/MFP2019%20GA%20Impact.pdf


  • By Gopinath Munisamy, Yangxuan Liu, and Adam Rabinowitz

    Click here to download the PDF version of this blog post.

    American agricultural and food producers have been caught in the middle of ongoing trade disputes between the United States and some of its major trade partners. Most trade partners – China, Mexico, Canada, and others – facing tariffs from the United States have chosen to retaliate against American agricultural exports.

    Last year, American agriculture lost overseas markets and revenues, some of which have been partly compensated by the Trade Mitigation Programs and exports to new sources. However, as the U.S. – China trade dispute gets reignited in May 2019, American agriculture faces several critical challenges, including 1) whether U.S. agriculture can recover from the original and continued loss of overseas markets; 2) will the tit-for-tat tariffs cloud the prospects for new markets for American agriculture; 3) how can American agriculture compete with its non-agricultural sectors for labor and capital/credit; and 4) whether the recent rise in farm wages and a decline in farm solvency ratios point to farm financial stress.

    Munisamy, Liu, Rabinowitz, and Dorfman recently released an article, entitled “The Costs to Agriculture from Recent Trade Disputes: A Georgia Perspective”. This article shares insights on the impact of the ongoing trade disputes on American and Georgia agriculture and on emerging farm financial stress. Detailed discussions on cotton, pecans, peanuts and broiler meat are included in the article. Agricultural and food producers nationwide have faced the direct effects of retaliatory tariffs, but changes in market prices alone may not fully capture the losses seen in crops that Georgia has large national shares in the production of, notably cotton, peanuts, and pecans. The search and adjustment costs for new and smaller markets may be reflected in a weakening local basis and an average national price for compensation will likely understate Georgia’s loss.

    Trade issues are compounding the financial stress already present in the agricultural production sector.  Nationally, the farm debt-to-equity ratio forecasted for 2019 is the highest of the past decade. At a time when many Georgia farmers are in tough financial conditions following several hurricanes, macroeconomic factors, especially the appreciation of the U.S. dollar, and a trade war add to the financial pain being felt by many producers. Georgia may actually be in a more vulnerable position than the average for American farmers.

    American agriculture appears to be buffeted by uncertain markets for products and inputs, and the marginal damage from the latest round of tariffs is likely to be significantly higher than the historical average. Whether the resolution of trade disputes will restore not only the original market access but also the foregone growth in American exports during the dispute remains an open question.

  • by Adam N. Rabinowitz

    On June 6, 2019, the disaster aid package (officially known as H.R. 2157, “Additional Supplemental Appropriations for Disaster Relief Act, 2019.”) was signed into law.  The bill contains substantial money that will aid Georgia in the recovery from Hurricane Michael, as well as addressing other disasters throughout the U.S. during calendar years 2018 and 2019, including Hurricane Florence, other hurricanes, floods, tornadoes, typhoons, volcanic activity, snowstorms, and wildfires.  I have outlined below key highlights of the legislation directly relevant to Georgia agricultural producers.

    • A total of $3 billion has been allocated to losses of crops (including milk, on-farm stored commodities, crops prevented from planting in 2019, and harvested adulterated wine grapes), trees, bushes, and vines.
    • Block grants will be provided to states for forest restoration, poultry, and livestock losses.
    • Tree assistance payments are to be made to eligible orchardists or nursery tree growers of pecan trees with a tree mortality rate that exceeds 7.5% (adjusted for normal mortality) and is less than 15% (adjusted for normal mortality) for losses incurred from January 1, 2018 and December 31, 2018.
    • Not more than $7 million for agricultural producers whose Whole Farm Revenue Protection indemnity payments were reduced following 2018 crop year losses due to state authorized disaster assistance programs.
    • Crops eligible for Federal Crop Insurance or Noninsured Crop Disaster Assistance Program (NAP) are limited to payments not to exceed 90% of the loss for those that obtained either of these policies. For producers that did not obtain available crop insurance or NAP, payments are limited to 70% of the loss.  The expected value of the crop is defined as the greater of the projected price or the harvest price.
    • Additional allocations were made for the Emergency Forest Restoration Program ($480 million), Emergency Conservation Program ($558 million), Emergency Watershed Protection Program ($435 million), and rural community facilities programs ($150 million).

    Keep in mind that dollar figures included here are not allocations only for Georgia but are for all producers throughout the nation that are eligible for aid.  It is expected that the crop losses will be managed through the Farm Service Agency (FSA) using the Wildfires and Hurricanes Indemnity Program (WHIP) in the same fashion as was applied in 2018 for Hurricane Irma, with the exception of the increased payment limits to 90% and 70% for insured and uninsured acres, respectively.  The signup process and payment dates are not known at this time.  More information is forthcoming.