-
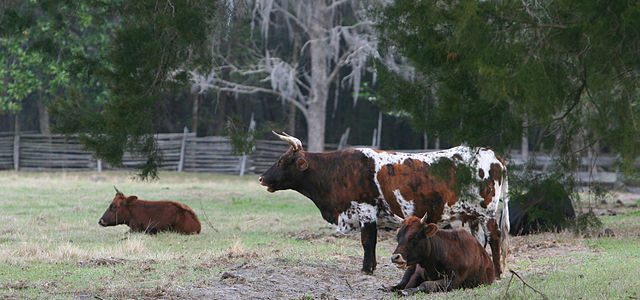
The latest IFAS bulletin discusses the difficulties that cattle ranchers in Florida are having after Hurricane Michael moved through in October. Hay is in short supply and winter grazing is behind schedule. But the producers are continuing to plug away and work on keeping their cattle in the best condition they can while watching the…
-

Southeast Farm Press reported this week that the North Carolina agricultural commissioner is urging farmers to look into new crops to help diversify themselves in case of bad weather or market unrest. Some of the crops include carrots for natural coloring, poplar for veneer and industrial hemp. You can read more at https://www.farmprogress.com/crops/nc-ag-commissioner-urges-farmers-take-serious-look-new-crops.
-

We’ve been watching for months, and today NOAA announced that El Niño has officially returned to the Eastern Pacific Ocean. The temperature conditions in the ocean have been showing a pattern that we expect in a weak El Niño, but until recently the atmospheric pattern did not match up with what we were seeing in…
-
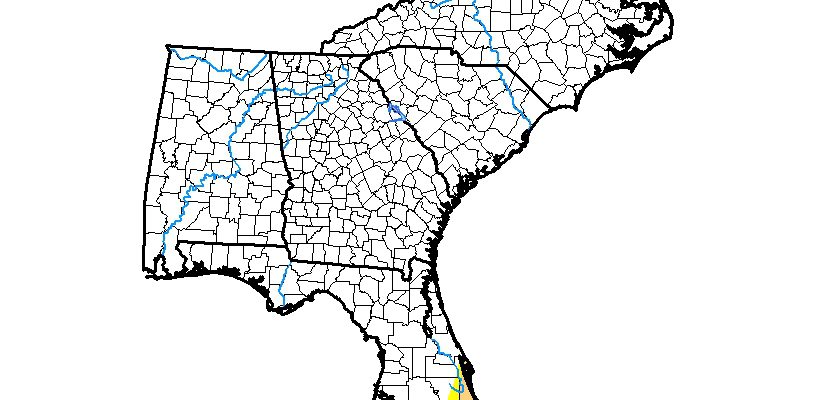
The latest Drought Monitor, released this morning, shows that the moderate drought in southeast Florida remains at the same level as last week. Parts of the Southeast will receive heavy rain in the next week, but those will almost entirely bypass the drought in Florida, so it is unlikely to be removed in next week’s…
Posted in: Drought -

Bloomberg posted an interesting story at the end of January about the frequency of dangerous cold snaps similar to the one parts of the US experienced in recent weeks. Data suggests that the cold Arctic outbreaks that used to blast into the US in winter are becoming less frequent over time as the climate warms.…
-
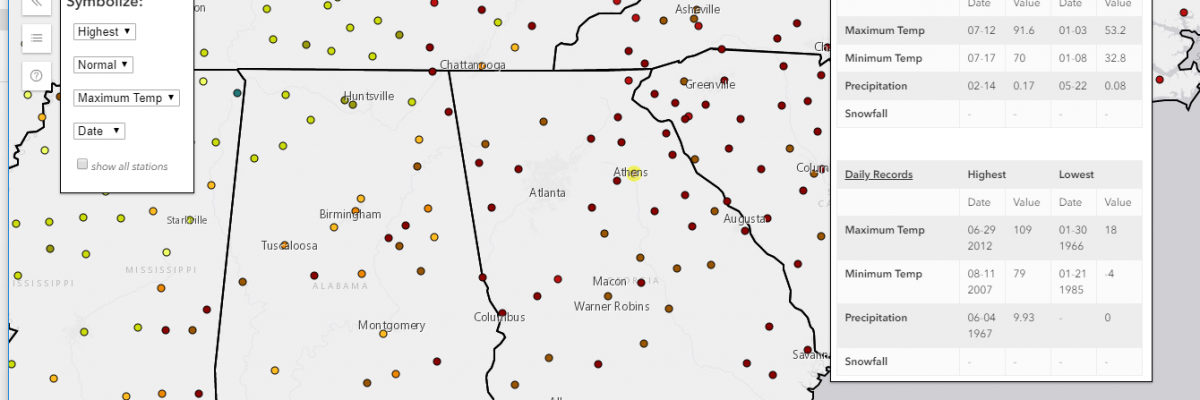
The Midwestern Regional Climate Center has a new online tool based on GIS that allows you to find record temperature and precipitation values for each station in the US. As far as I can tell, it does not included threaded records like the long combined city/airport stations in major cities, but does include the most…
Posted in: Sources of weather and climate data -
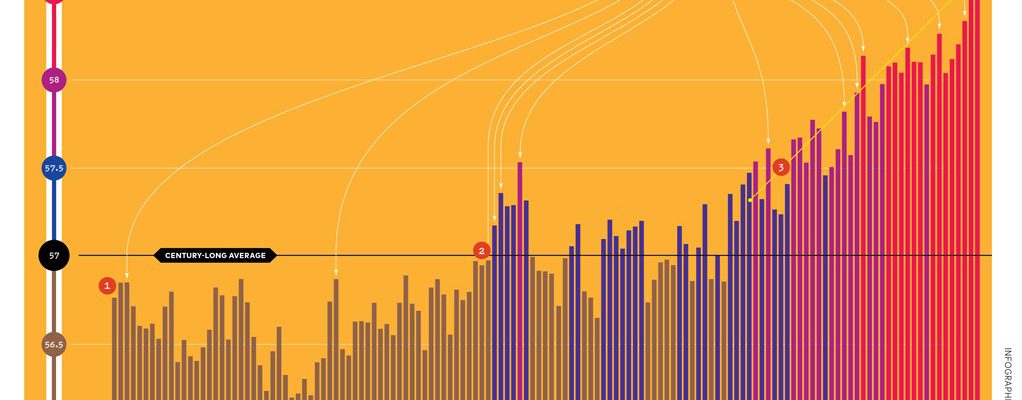
This week Popular Science posted an interesting new graphic on the global temperature. In addition to the yearly totals, it also highlights when the record high years occurred as the record got longer. It also highlights year by how much the temperature was above the long-term average. You can see a better view and read…