-
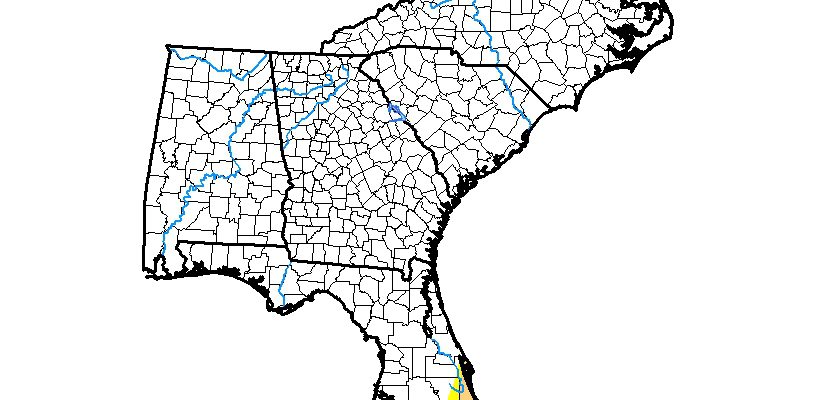
The latest Drought Monitor, released this morning, shows that the moderate drought in southeast Florida remains at the same level as last week. Parts of the Southeast will receive heavy rain in the next week, but those will almost entirely bypass the drought in Florida, so it is unlikely to be removed in next week’s…
Posted in: Drought -

Bloomberg posted an interesting story at the end of January about the frequency of dangerous cold snaps similar to the one parts of the US experienced in recent weeks. Data suggests that the cold Arctic outbreaks that used to blast into the US in winter are becoming less frequent over time as the climate warms.…
-
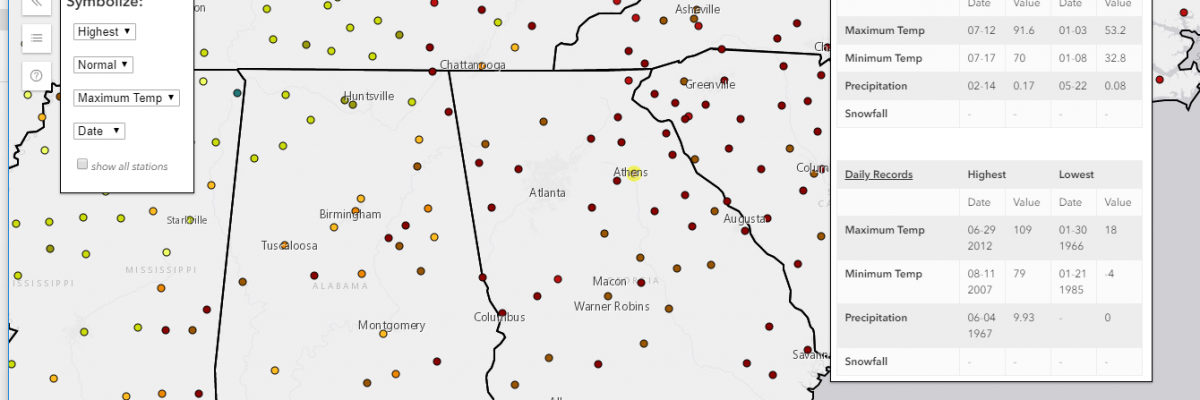
The Midwestern Regional Climate Center has a new online tool based on GIS that allows you to find record temperature and precipitation values for each station in the US. As far as I can tell, it does not included threaded records like the long combined city/airport stations in major cities, but does include the most…
Posted in: Sources of weather and climate data -
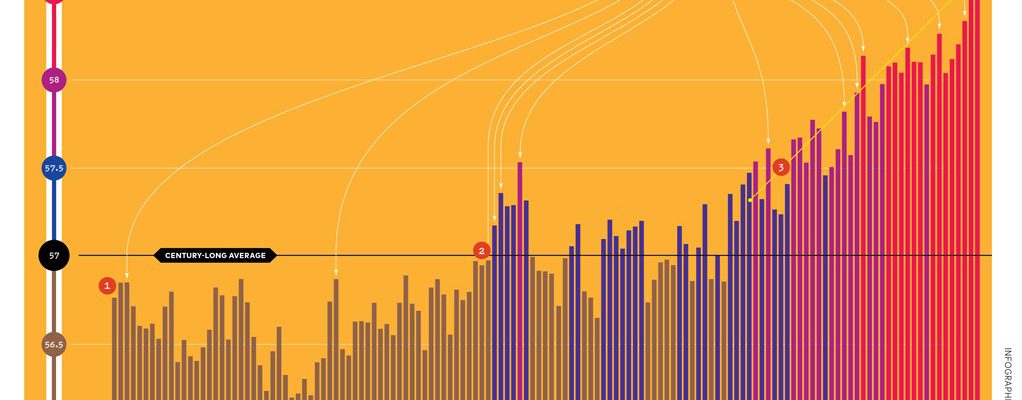
This week Popular Science posted an interesting new graphic on the global temperature. In addition to the yearly totals, it also highlights when the record high years occurred as the record got longer. It also highlights year by how much the temperature was above the long-term average. You can see a better view and read…
-
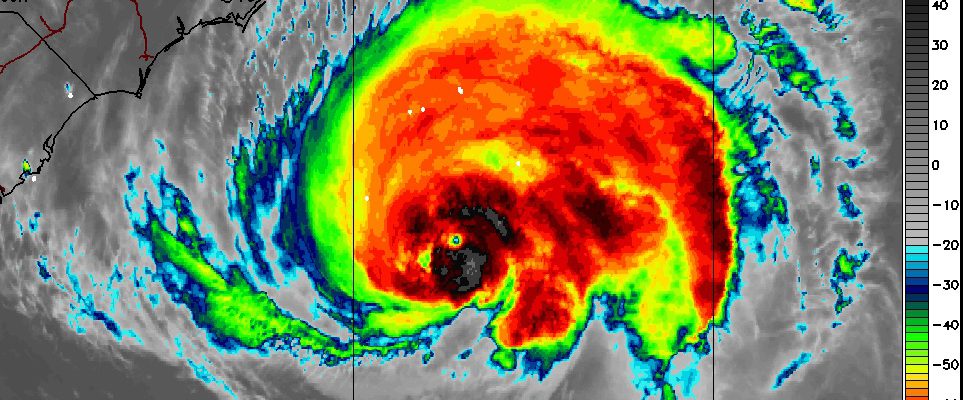
The latest hurricane summary from NOAA for Hurricane Florence indicates that it was even more costly than originally estimated. According to The State, “The final tally on damage from Hurricane Florence is higher than the costs from 2016’s Hurricane Matthew and Hurricane Floyd in 1999 combined, new federal estimates show. Florence’s final cost was $24…
-

Recent news stories have shown that 18 out of the past 19 years have been the earth’s warmest years on record (records began in 1880). But when were the coldest? It turns out that all of these years took place between 1884 and 1929, with the most freezing year of them all being 1904. The…
-
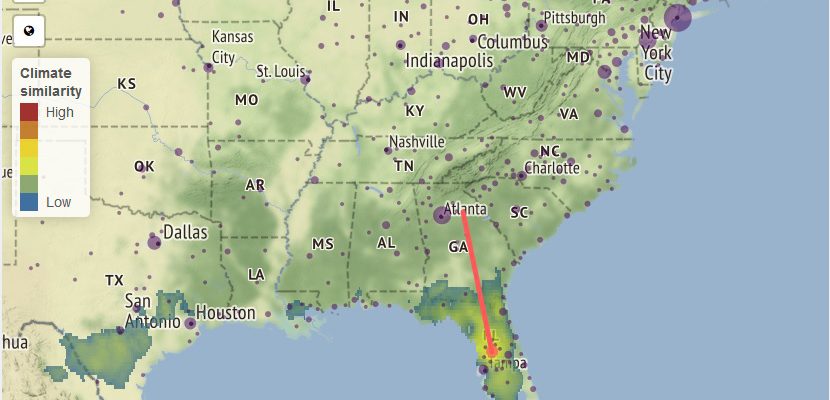
Here is a fun tool to try to visualize what the climate of your city (or whatever city you choose) is most likely to be like in 60 years. It allows you to pick what emissions scenario to choose (business as usual versus reduced emissions) and shows either the average result or the individual results…