-
Earlier today I posted about the newly released final report on Hurricane Michael from NOAA’s National Hurricane Center. You can find the link to the report in an earlier blog post today. Here is an interesting article from Bob Henson at Weather Underground which looks into the details of the report, including how the NHC…
-

This week BBC broadcast a new 1-hour special on the science of climate change which provides a very good overview of the current state of climate science. The story is told from a British viewpoint but provides an excellent overview of climate change, how we know it exists and how it is changing our earth’s…
-
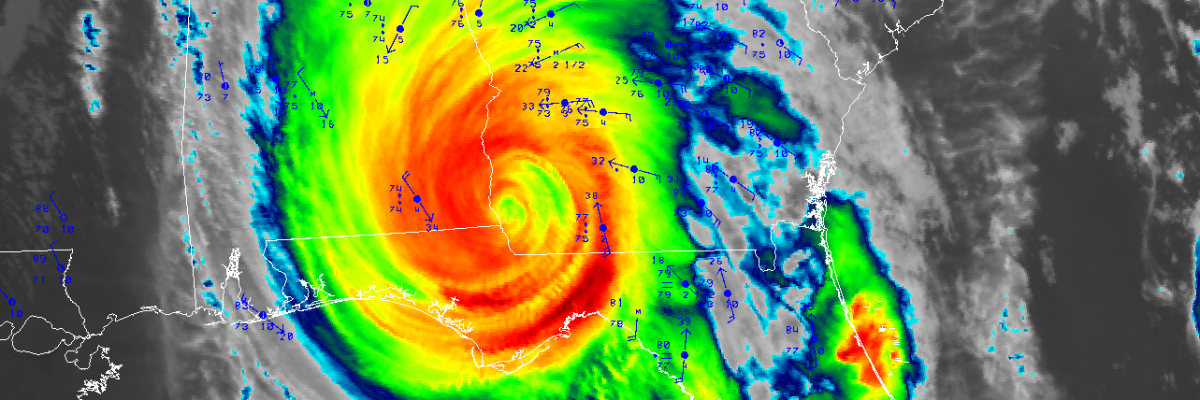
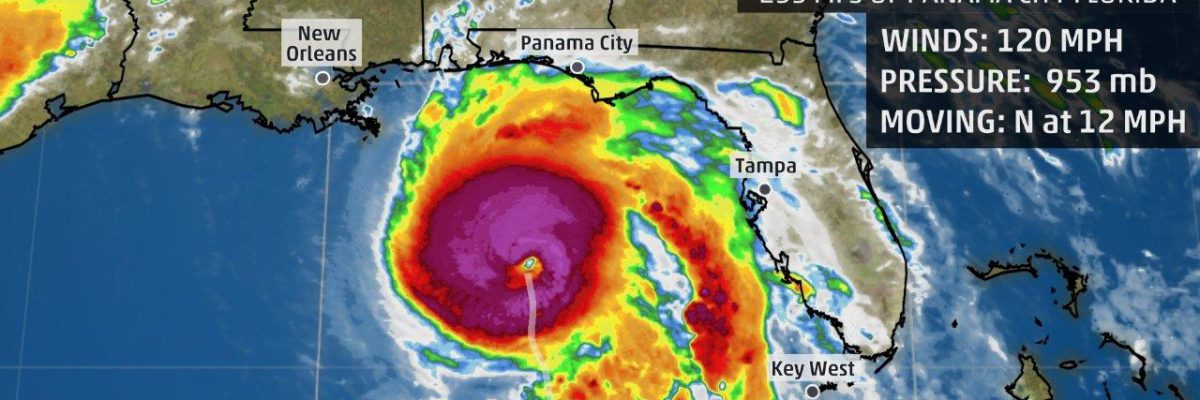
NOAA’s National Hurricane Center released their official report on Hurricane Michael today. It officially notes that Michael was a Category 5 storm. The report includes a number of observations from the University of Georgia weather network as well as many other sensor networks. You can read it at https://www.nhc.noaa.gov/data/tcr/AL142018_Michael.pdf.
-

The latest monthly and seasonal outlooks from NOAA’s Climate Prediction Center, released today, indicate that warmer and wetter than normal conditions are likely to continue through the months of May, June and July. This means that the moderate drought that is currently in place in parts of the Southeast is likely to be eliminated over…
Posted in: Climate outlooks -

Do you have trouble understanding how to interpret the monthly climate outlooks put out by NOAA’s Climate Prediction Center? Then this webinar is for you! On Monday, April 22, there will be a webinar at 2-3 pm EDT (1-2 PM CDT) on how to read these maps and interpret the results. You can register for…
-
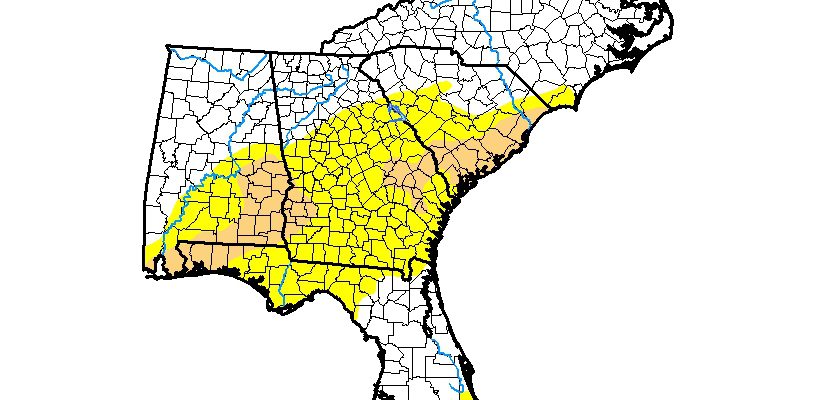
The latest Drought Monitor, released this morning, shows that the areas of moderate drought in southeast Alabama, eastern Georgia and southern South Carolina were slightly reduced this week in response to rains over the last week. I expect to see more improvements in next week’s map due to rains expected in the next few days…
Posted in: Drought -

Trend magazine produced an interesting map of the earth this week showing where water is being gained or lost using microgravity measurements from satellites. It shows that some areas of the world like the Central Valley of California are losing water due to groundwater depletion, while the big ice sheet of Greenland is losing water…