Sources of weather and climate data
-
Are you frustrated that the Drought Monitor is not accurately reflecting dry conditions in your area? It may be that they do not have any data there other than radar-based rainfall. Reports from “on the ground” can be invaluable for drawing the correct drought lines. Here is a new mobile-friendly site for reporting drought conditions…
-
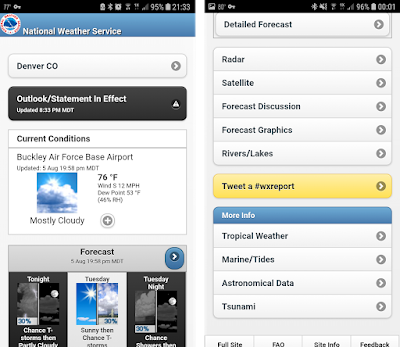
I get asked from time to time what weather apps I use on my smartphone. Let me say at the outset that I am a minimal smartphone user, so I am probably not the person to ask about this. But I do have a couple of apps on my phone so I can check the…
-
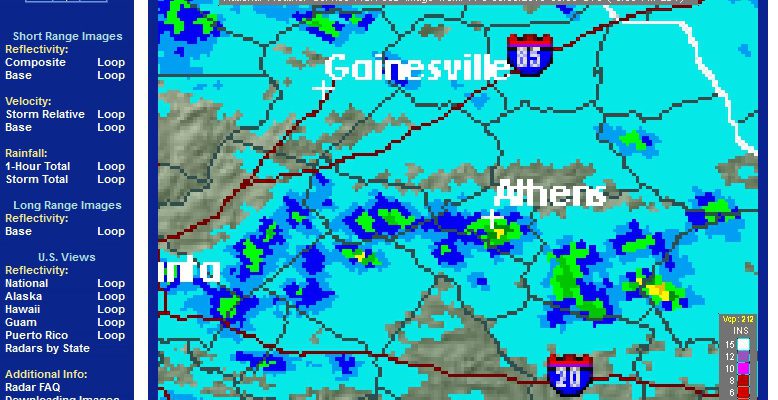
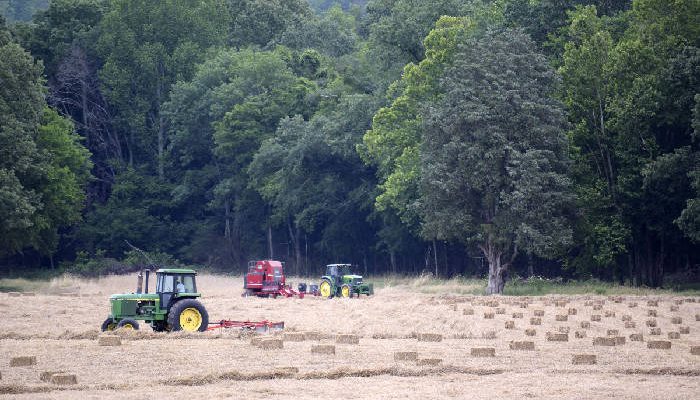
Summer rainfall can be highly variable in space and time. You’ve probably all seen a shaft of rain covering part of your town while bypassing other areas, or compared rainfall amounts with neighbors and found quite a difference from your own. If you are monitoring a county for rainfall amounts or have fields scattered over…
-
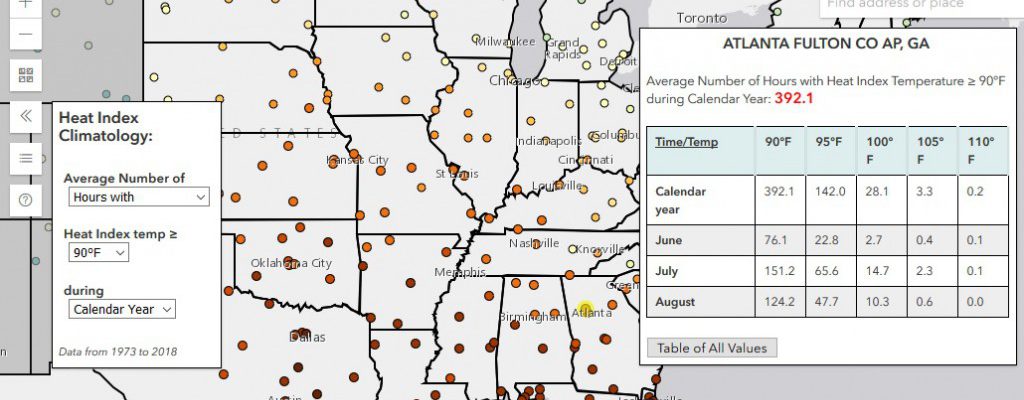
Just in time for the latest heat way, the Midwestern Regional Climate Center announced a new interactive heat index map for the US which shows the average number of hours with the heat index above several thresholds. This is available for the first order weather stations at the larger airports. You can view it at…
-

Here is a message from the Southeast Regional Climate Hub (USDA) about presentations from their recent workshop on Building Agricultural Resistance to Hurricanes. Please see below for the links to the different sessions. We’re pleased to announce that presentations from the Building Agricultural Resilience to Hurricanes Workshop are finally available online. See links below. Sorry…
-

If you have ever been asked for the climate projections for your county, here is a useful website which provides some of that information. The Climate Explorer at https://crt-climate-explorer.nemac.org/ allows you to look down to the county level to determine projections of future temperature, precipitation, and degree days for a couple of different climate scenarios.…
-

You may have seen the graphic “climate stripes” for the US showing the annual temperature for each year as a colored stripe. They’ve been made into scarves, rugs, ties and other articles and show how recent years are warmer (redder) than previous years. It’s an interesting way to view the changes in climate that we…