Sources of weather and climate data
-
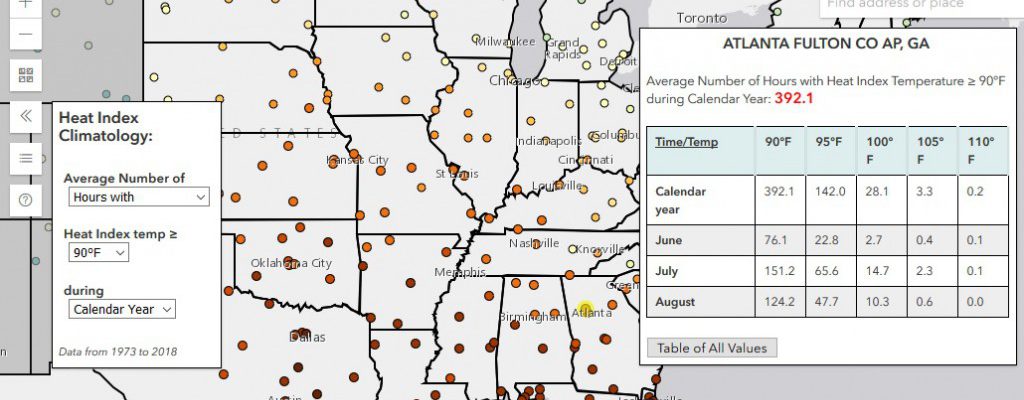
Just in time for the latest heat way, the Midwestern Regional Climate Center announced a new interactive heat index map for the US which shows the average number of hours with the heat index above several thresholds. This is available for the first order weather stations at the larger airports. You can view it at…
-

Here is a message from the Southeast Regional Climate Hub (USDA) about presentations from their recent workshop on Building Agricultural Resistance to Hurricanes. Please see below for the links to the different sessions. We’re pleased to announce that presentations from the Building Agricultural Resilience to Hurricanes Workshop are finally available online. See links below. Sorry…
-

If you have ever been asked for the climate projections for your county, here is a useful website which provides some of that information. The Climate Explorer at https://crt-climate-explorer.nemac.org/ allows you to look down to the county level to determine projections of future temperature, precipitation, and degree days for a couple of different climate scenarios.…
-

You may have seen the graphic “climate stripes” for the US showing the annual temperature for each year as a colored stripe. They’ve been made into scarves, rugs, ties and other articles and show how recent years are warmer (redder) than previous years. It’s an interesting way to view the changes in climate that we…
-

Here is an interesting animated map which shows the accumulation of FEMA flood insurance claims over time. As you watch it spool from 1970 to 2018 you can see the impacts of some big events like recent hurricanes and the floods of 1993 in the Upper Midwest. The Southeast has some areas that have been…
-

The State Climate Office of North Carolina announced this week that they are welcoming a new director who will also serve as the State Climatologist. Kathie Dello comes to the Southeast from Oregon, where she was the Associate Director of the Oregon Climate Change Research Institute and Deputy Director of the Oregon Climate Service, the…
-

With the hot temperatures that are forecast to occur in the Southeast next week, I’ve been getting some questions about how you determine when the average date of first occurrence of 90 F is for a given location. Here is a way to do it using XMACIS2, an online data search tool from the Regional…