Interesting weather images
-
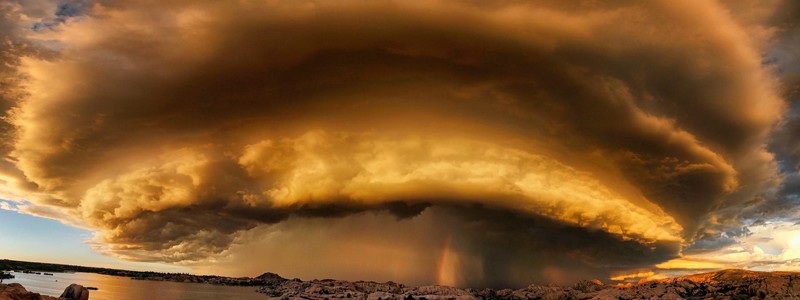
NOAA has announced their weather photography contest winners for this year. You can view them at https://www.weather.gov/photocontest/.
Posted in: Interesting weather images -
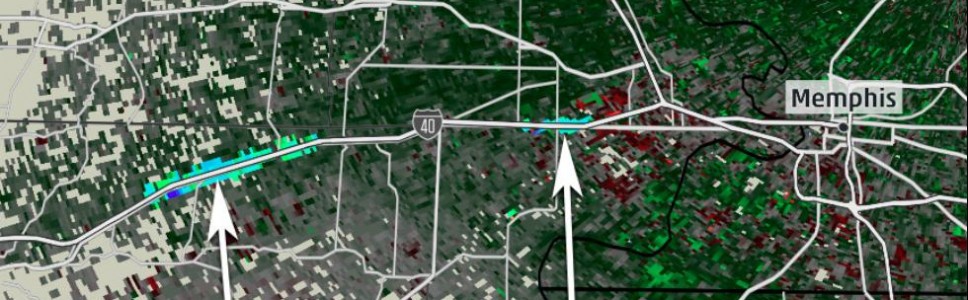
The Weather Channel has an interesting series of photos which show some of the strange things that have shown up on NWS radar since the Doppler radar went live in the mid-1990s. You can see them by clicking here. When I lived in Wisconsin, the NWS folk at NWS Sullivan told me they could see…
Posted in: Interesting weather images -

The center of TS Bill has hit the coast of Texas near Matagorda Island TX. Rain is extending far outside the immediate center of circulation and on radar you can see bands as far north as eastern OK and as far east as the bootheel of Louisiana. I love this streamline image from https://earth.nullschool.net/#current/wind/surface/level/orthographic=-97.36,28.39,1095–you can zoom…
-

NASA released a satellite time-lapse video earlier this week showing this year’s return of the monsoon rains to India. You can view it at https://www.nasa.gov/feature/goddard/nasa-sees-the-start-of-indias-monsoon-season. The official start of the monsoon season this year was June 5, a little later than usual. A strong heat wave in the days before the delayed start of the…
-

On April 22, 2015, Calbuco Volcano erupted in Chile. I discussed it in my blog here. Now one of the lovely results of this eruption is a series of volcanic sunrises and sunsets in Africa and other Southern Hemisphere locations as the high level aerosol layer reflects sunlight back when the sun is just below…
-
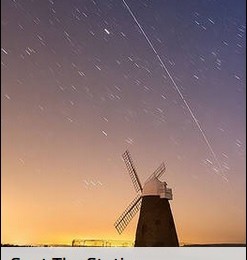
If you like to watch interesting things flying by overhead, you might be interested in looking for the International Space Station. When it’s zooming past your area, it’s usually the third brightest object in the sky. But how do you know when to look? You can sign up for notifications for when the ISS is…
-
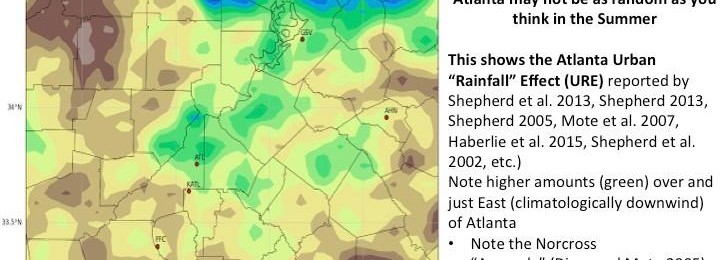
Jordan McLeod of the Southeast Regional Climate Center put together this nice graphic showing the impact of Atlanta on summer rainfall in North Georgia. Dr. Marshall Shepherd of UGA provided the commentary and posted it on Facebook.