Interesting weather images
-

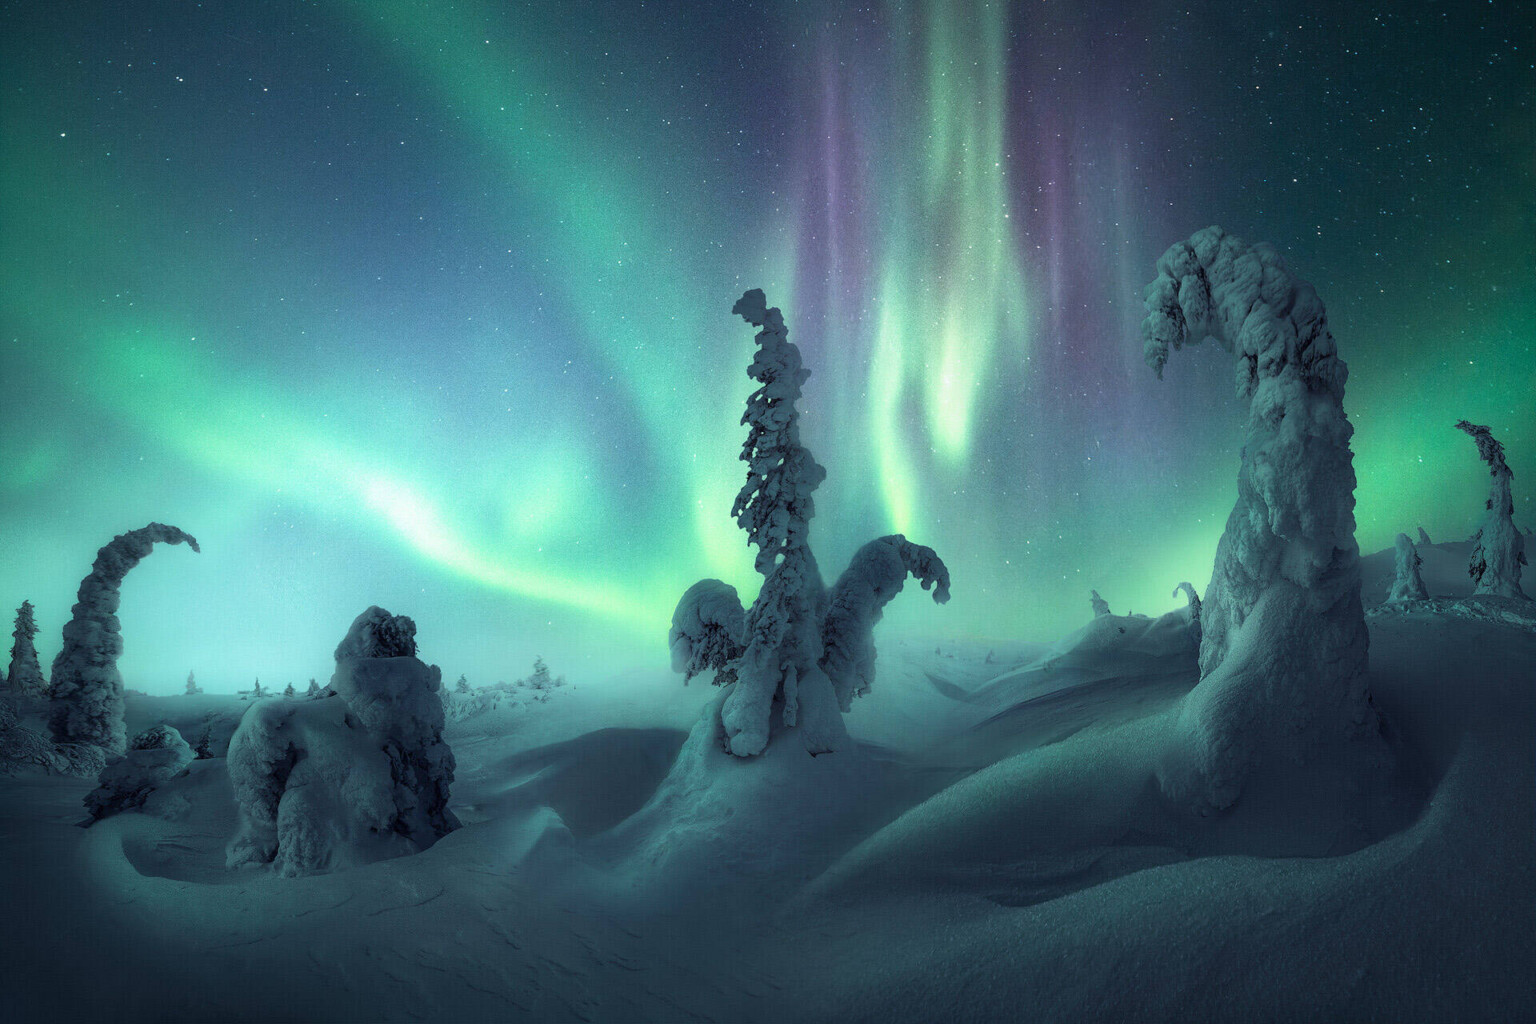
Have you ever seen the Northern Lights? If you have lived in the Southeast all your life, most likely not. But when I lived in Wisconsin, I was blessed to see them once, on a cold winter night over a lake near my apartment. The red color was so intense our local meteorologist told us…
Posted in: Interesting weather images -

As we get closer to the cold and snow that is expected in the next few days, you may be interested in viewing where the biggest impacts are occurring, especially if you are going to be traveling. NOAA has a good map depiction of where winter storm impacts are expected to occur over the next…
-

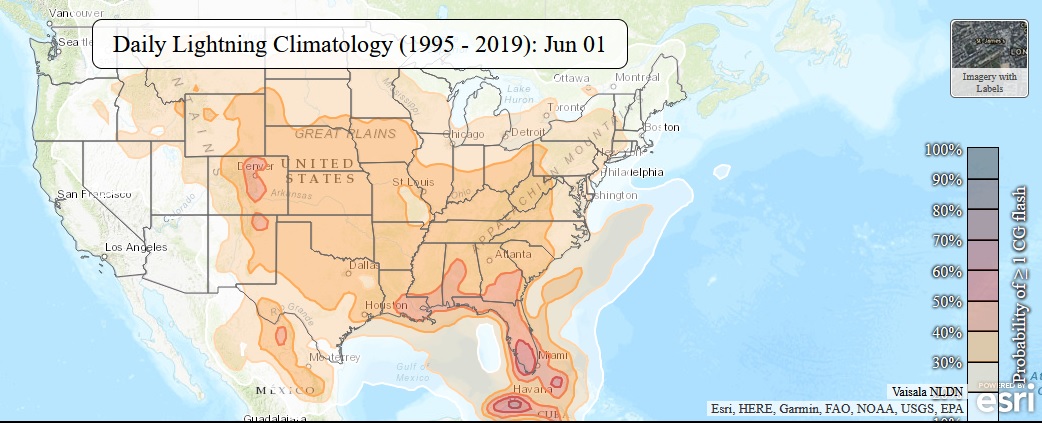
Here is an interesting map display from NOAA’s Storm Prediction Center that shows the daily distribution of lightning stokes across the United States. It is very interesting to see how the area of most lightning strikes moves around over the course of the year. You can view it at https://www.spc.noaa.gov/climo/dataviewer/?mode=climo&category=ltg&product=ltgday.
-

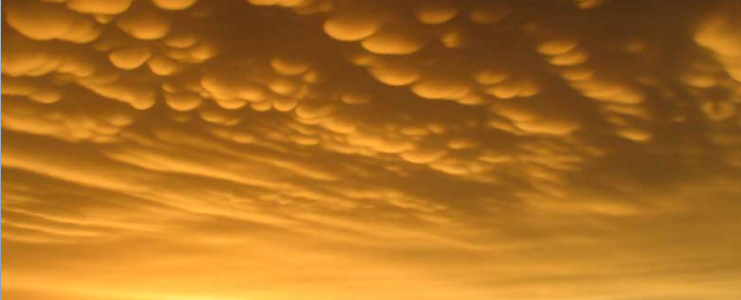
If you love to look at pictures of clouds or want to know what kind of cloud or optical phenomenon you are seeing in the sky, this new cloud library is for you! The Cloud Appreciation Society has launched a new cloud library at https://cloudappreciationsociety.org/cloud-library/ that shows amazing pictures of different cloud types as well…
Posted in: Interesting weather images -

If you are interested in looking at “after” images of coastal areas after Hurricane Ian’s passage to see what damage occurred at particular properties, you can go here to view images taken from NOAA aircraft. By zooming in and out you can focus on particular locations. There should be imagery available for multiple coastal areas,…
-

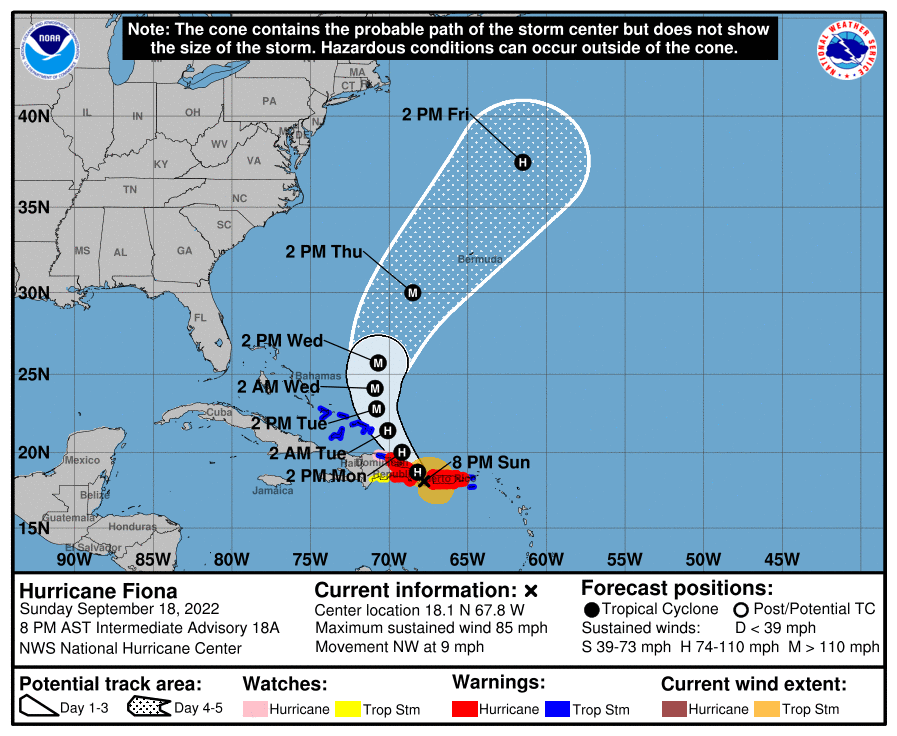
With the recent increase in hurricane activity in the Atlantic, you may be seeing pictures of the National Hurricane Center’s forecast cones for upcoming storms. There is a lot of misinformation about what the cone means and what it does not mean. NOAA provided this short video that explains how the cone is drawn and…
-

If you love watching the clouds, today is your day! According to their website, “This year, for the first time, the Cloud Appreciation Society is launching Cloud Appreciation Day on Friday September 16th. This will be an internationally recognized day when people around the world are encouraged to spend a few moments appreciating the beauty…