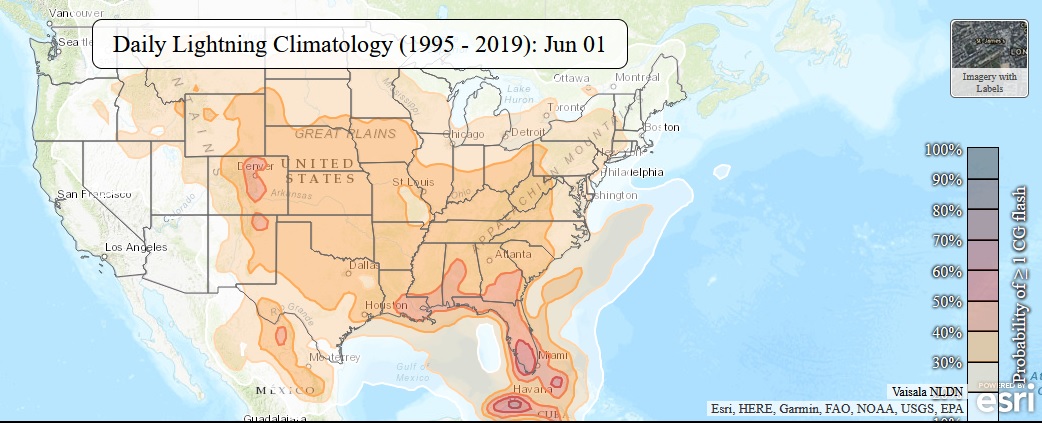
Here is an interesting map display from NOAA’s Storm Prediction Center that shows the daily distribution of lightning stokes across the United States. It is very interesting to see how the area of most lightning strikes moves around over the course of the year. You can view it at https://www.spc.noaa.gov/climo/dataviewer/?mode=climo&category=ltg&product=ltgday.