Climate science
-

As a follow-up to the last posting on the heat dome in the central US, Bob Henson of Weather Underground posted this lengthy article about how a heat spell like the one that is coming can trigger the development of a “flash drought”, in this case most likely in the Corn Belt region, although it…
-

If you have kids or work with kids (or know a 4-H leader or teacher who does), you might be interested in this web site from the National Weather Service with some resources on weather science and safety. You can find it at https://www.weather.gov/owlie/, and it features Owlie Skywarn, their weather mascot.
Posted in: Climate science -

The State Climate Office of North Carolina posted a description of the locally heavy rains that occurred in central NC this past Saturday on their blog at https://climate.ncsu.edu/climateblog?id=197&h=5666e5c1. One CoCoRaHS observer in Cary NC reported 7.52 inches for the day. Estimates of the return period are that some areas received a 100-year event or more. If…
-

I’m taking a break from the blog for ten days while I attend a conference on high impact weather and climate and celebrate my my 25th wedding anniversary with my husband John Knox and friends. While I’m gone, you can find a list of web sites that you can use to find your own weather and…
-

July 4 marked the day when the earth was the farthest from the sun in its orbit around our favorite star (we call that aphelion). In spite of what you might think, the seasonal swings in temperature are not controlled by our distance from the sun but by the tilt of the earth towards or…
-

Fortune magazine posted an interesting article late in June on the complicated relationship between farmers and their acceptance of climate change. Fortune points out that farmers are among the most likely to be affected by climate change, and yet are one of the least likely groups to accept the scientific evidence for it, even though they…
-
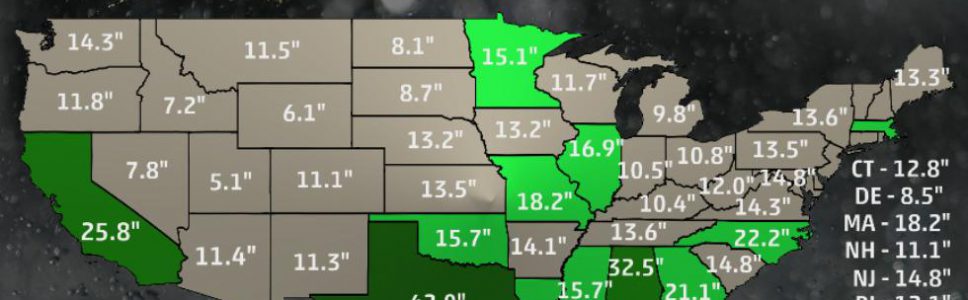
Weather Underground’s latest blog post describes NOAA’s recent infographic, which shows the highest 24-hour rainfall amounts in each state. You can read more about it here. As you might expect, the Southeast has the highest record amounts because the heaviest rain is generally associated with tropical storms or hurricanes coming onshore and dumping prodigious quantities of…