Climate science
-
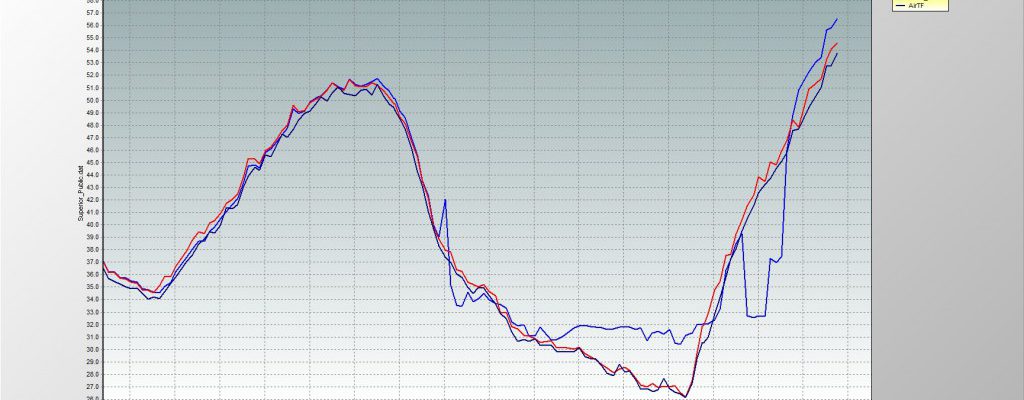
This is the coolest graph I have seen today. Maybe this week. From retired UGA ag extension agent Rad Yager, who got this from a blueberry producer near Homerville GA. It shows temperature traces from two ambient air sensors plus one that was exposed to irrigation water used for frost protection last night. You can…
-

Of all the places in the United States that are experiencing changes due to a warmer climate, Alaska is on the forefront. I thought this Bloomberg article on how Alaska is (and is not) handling the warmer climate was interesting. Their coastal cities are especially vulnerable to increased sea level and lower amounts of sea…
-
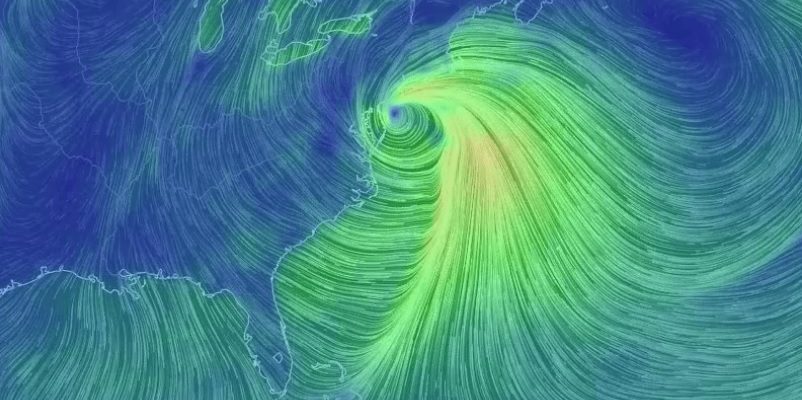
The nor’easter which developed along the east coast today has really cranked up. Athensgaweather.com showed this great image of the circulation around the low pressure, which at the time I wrote this was just off the coast of Long Island. The image is from earth.nullschool.net, one of my favorite sites. Make sure to go there to…
-

The Weather Channel produced a video and article last week that described some of the toughest places in the United States to forecast the weather. It turns out that it depends on the season and can also vary from one year to the next. Included in the list are two places in the Southeast: the…
-
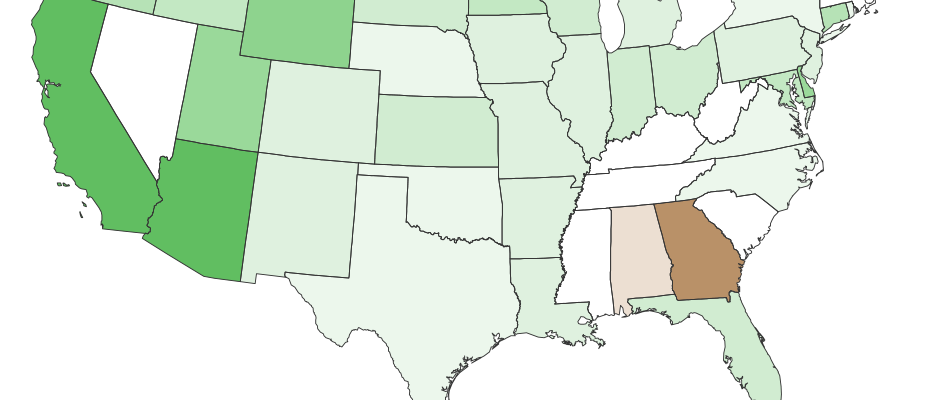
I was doing some research for a project this week and ran across the EPA website of climate change indicators at https://www.epa.gov/climate-indicators/. Fortunately, it is still available at the EPA web site. I have also downloaded a copy of the full report to keep on hand, just in case. One of the things that really surprised…
-
Farmers use a variety of techniques to help protect their vulnerable crops against frost damage when temperatures get near 32 F, including irrigation, large fans, or other heating methods. But it is hard to know when to start the frost prevention measures, because if you wait until it gets to 32 F, then it is…
-
Did you wake up this morning already feeling behind? The loss of an hour last night probably contributed to that. Dr. Marshall Shepherd has an interesting post at Forbes.com today about Daylight Saving Time. You can read it here. I used to be more concerned about it when I worked in Wisconsin and was doing…