I noticed when I was looking at the hourly weather forecast for Athens that the next two nights will both have freezes here in Athens, but the types of freezes will be quite different. You can see it quite well using the hourly graphical temperature forecast, so I thought I would discuss them using the forecast as a diagnostic tool. If you don’t know how to get these graphical forecasts, I discussed it in a blog post in 2018 at https://site.extension.uga.edu/climate/2018/03/where-to-get-hourly-weather-forecast-information/. They are very useful for situations when you need to know short-term weather data like wind speeds for spraying or temperature and dewpoint for frost protection for blueberries, for example. Generally this information is a lot more accurate than anything you can get off a weather app, although there are times when it will not be exactly right, either. And since they go out to 6 days ahead, that gives you time to plan for threatening weather before it happens. The forecasts are updated several times a day, so be sure to check back regularly, especially for an event several days ahead, since changes are likely.
Here is the hourly forecast for the next two mornings for Athens that I pulled off the website today:
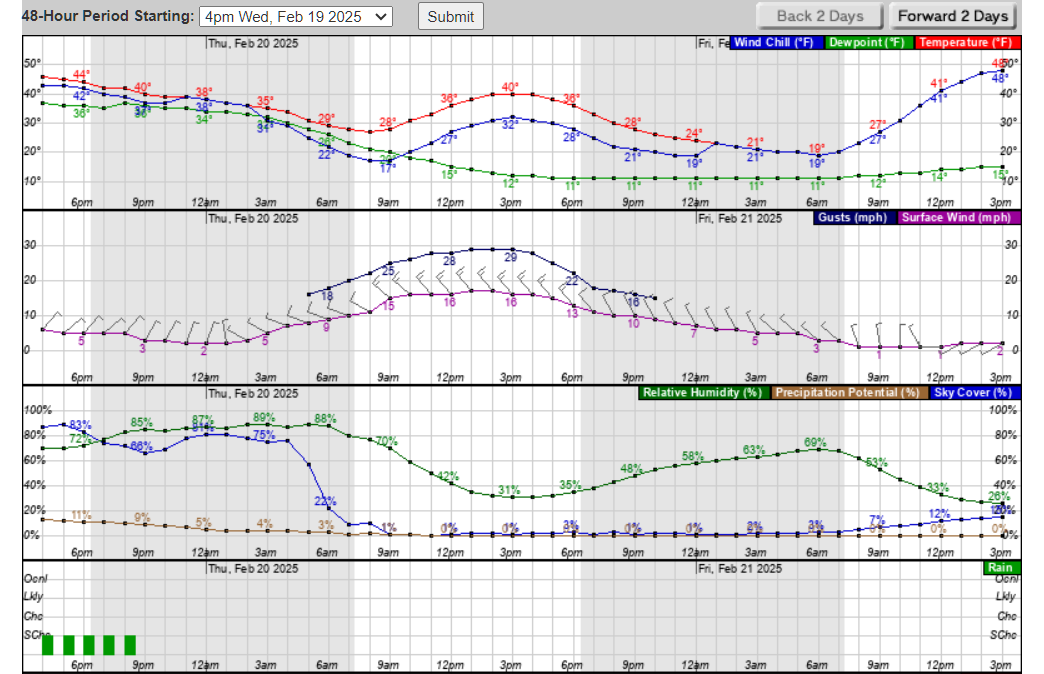
If you don’t know how to read them, here is an explanation. The time is shown on the bottom horizontal line and the background is divided into day (white) and night (gray). The top panel of the forecast graphic shows temperature (red) and dewpoint temperature(green). It also shows wind chill in winter and heat index in summer (Sorry to those of you who are colorblind, I know this might be hard to read in that case.) The second panel shows wind speed and direction and gusts. The purple line shows the expected sustained hourly wind speed with the direction shown as an arrow. Sustained winds are generally the average winds over a minute or longer. Wind is always shown in terms of where it is coming from, so if the arrow is pointed straight down, then the wind is coming straight from the north towards the south. If the arrow is pointed to the left, then the wind is blowing east to west, etc. The “feathers” on the arrow just duplicate the wind speed shown on the purple line–more feathers equals a higher wind speed. The blue line above it shows wind gusts, which are instantaneous winds that only last for a second or so but are higher in speed than the sustained winds. Gusts are only shown when they are expected to be at least 5 mph higher than the sustained wind. The third panel shows relative humidity, probability of precipitation, and sky cover or cloudiness. The higher the sky cover, the more of the sky is covered by clouds. The fourth panel shows the likelihood of precipitation by hour with an estimate of the amount of rainfall when rain is likely. The hourly forecast also contains other panels for different types of wintry precipitation but I have not included them here because they are blank today.
For both Thursday and Friday mornings the coldest temperatures will occur near sunrise around 7 am, which we expect because temperatures generally drop at night since the sun has not been shining for hours. On Thursday morning the temperature is predicted to get down to 27 F with a dewpoint of 21 F, fairly strong and gusty winds from northwest and cloud cover which lasted most of the night but is clearing out near sunrise. This is what an advection freeze looks like. The freezing air is blowing into the region from more northern areas where it is generally colder and drier than your location. In an advection freeze it can be difficult to do frost protection because the wind makes it difficult for clear ice to form on blueberry bushes, making protection spotty. (Thursday morning update–as of 7 am, the temperature is 30 F, the dewpoint 23 F, winds 13 mph from the west gusting to 24 mph, and it is overcast. The cloud cover and higher wind speed probably contributed to the temperature and dewpoint being a little higher than predicted.)
On Friday morning, the temperature is also expected to be below normal, but the conditions will be quite different. The low is expected to 19 F with a dewpoint of 11 F. This means the air is much drier than it was yesterday. The wind will be just a couple of miles per hour and there will be no clouds at all. The lack of cloud cover allows heat from the surface to escape to space, resulting in more cooling at the surface than above the surface. That is why it is called a radiation freeze. This can result in what is called an inversion, where temperature above the ground is warmer than the temperature at ground level. The dewpoint (and relative humidity, which is related) is very low, which means that if you are using irrigation to do frost protection, the spraying will have a hard time keeping up with the dry air and you will have to pump a lot of water onto the blueberry bushes to keep them from getting freeze damage. In some systems, the nozzles that emit the water cannot keep up with the volume of water needed and the freeze protection will fail, resulting in bushes weighed down with ice that could cause breakage of the branches. You can read more about this at https://secure.caes.uga.edu/extension/publications/files/pdf/B%201479_2.PDF. If you are not able to access it, email me and I will be glad to send you a copy. Sometimes you can mix air from the inversion down to the surface using fans or helicopters and that can help to protect crops, but it is expensive to use those methods and does not protect a large area. Note that inversions only form when winds are light, because if the wind is strong, it mixes the air from the surface up quite a ways, eliminating any temperature difference with height.
Both types of weather conditions result in a freeze, but how they impact crops and affect frost protection can vary. Knowing what the temperature, dew point, wind speed, and cloud cover are will provide you with useful information to help you manage your crops successfully. In the tropical season, it can also give you an idea of when the worst wind and rain will be as a tropical storm or hurricane approaches, but the local forecast can change a lot over time as the hurricane forecasts are updated and the forecast cone shifts. I hope this look at the hourly graphical weather forecasts and how they can be used to describe different weather conditions has been useful to you. If you use the hourly weather forecasts to make other farm management decisions, I would love to hear about them.