The following is copy from the latest release from the National Drought Mitigation Center:
Within the announcement, there are a few links that will provide additional information. These include:
U.S. Drought Monitor statistics (Drought Map)
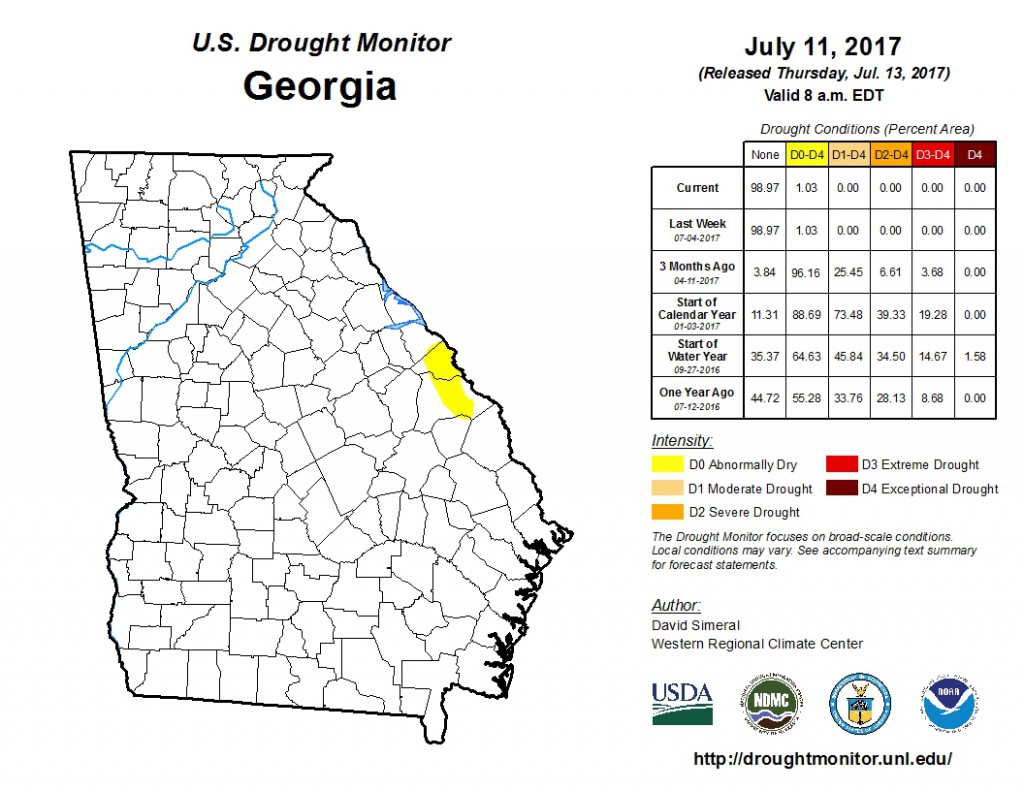

U.S. Drought Monitor for July 11, 2017:
For the contiguous 48 states, the U.S. Drought Monitor showed 9.60 percent of the area in moderate drought or worse, compared with 8.45 percent a week earlier.
Drought now affects 17,081,346 people, compared with 15,801,723 a week earlier.
For all 50 U.S. states and Puerto Rico, the U.S. Drought Monitor showed 9.10 percent of the area in moderate drought or worse, compared with 8.13 percent a week earlier.
Drought now affects 17,279,896 people, compared with 15,982,004 a week earlier.
To find populations affected by drought for specific states or time periods please visit https://droughtmonitor.unl.edu/MapsAndData/DataTables.aspx
Just select one of the Population types from the Statistic Type pulldown.
The attachments include the weekly map and narrative as well as the one-week change map.
For complete U.S. Drought Monitor statistics and additional products and information, please visit https://droughtmonitor.unl.edu
“U.S. Crops in Drought” is updated each week: