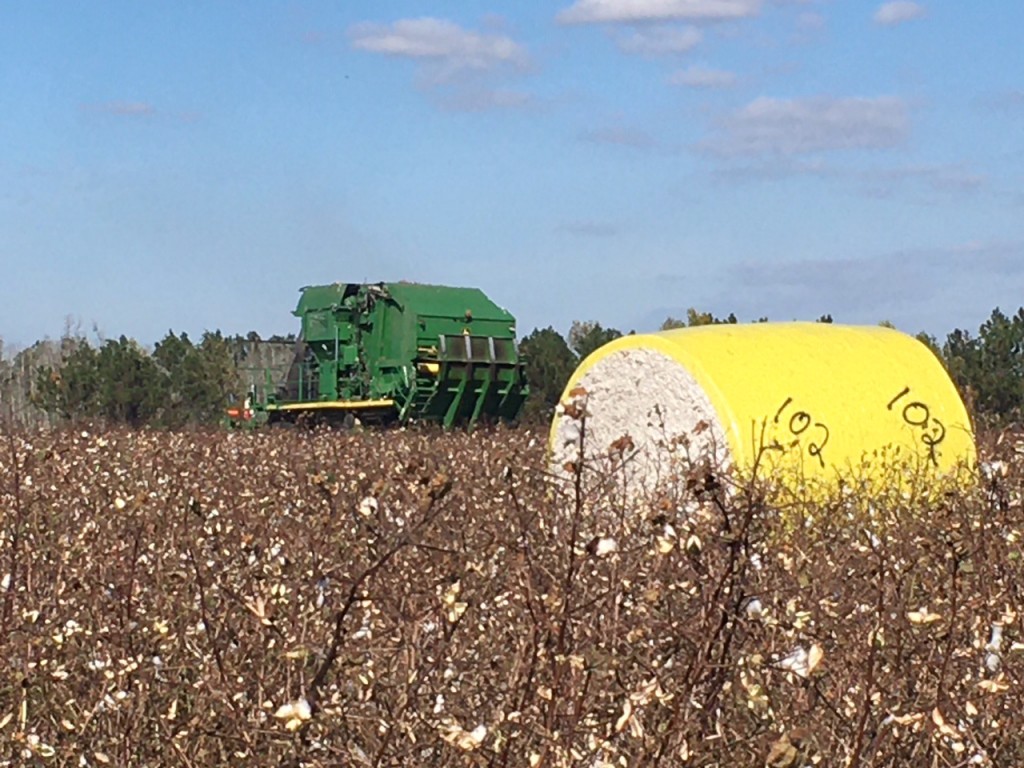
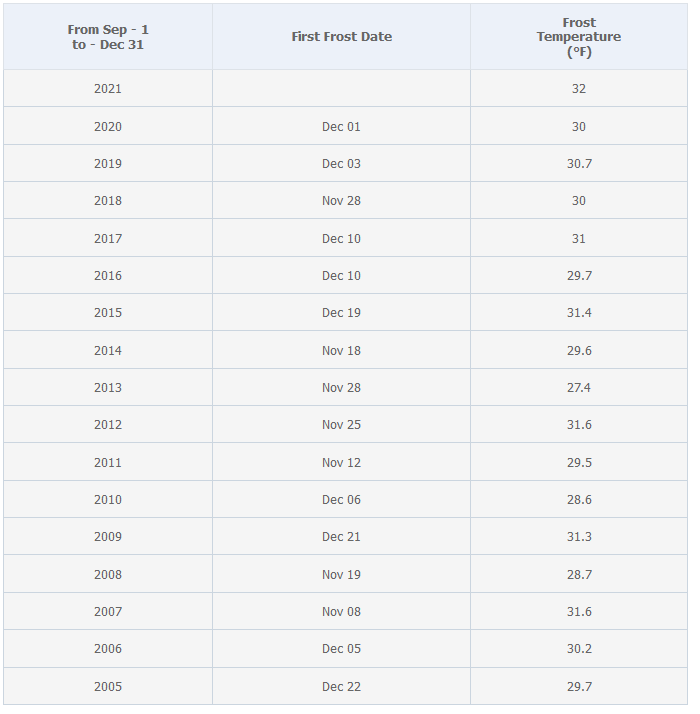
It has been another exciting week in Colquitt County agriculture. The Sunbelt Ag Expo and the cold weather were topics of discussion this week. Cotton defoliation and when to dig peanuts were common questions from growers. There was a little bit of frost in Colquitt County on October 19, 2022. It has been a few years since a frost event was noticed in Colquitt County in October. Below are the first frost dates going back to 2005 from the UGA Weather Station located at the Sunbelt Ag Expo.
Colquitt County Cattlemen s Update Newsletter — I sent out a newsletter to the local cattlemen this week. It is available here if you would like to look at this. Topics include the BQA training this coming on next week, vaccines, and winter annual forages.

All about the Pod podcast
Here is the link to the latest Peanut Pod Cast from the UGA Peanut Team .
Anchor: https://anchor.fm/macie-wheeler1/episodes/Episode-5—October-Frost–Grade-and-Yield-Decline-e1pj4c6
Spotify: https://open.spotify.com/show/3JSXq7ZTzhTVPUfUD8YxwR
Apple Podcasts: https://podcasts.apple.com/us/podcast/all-about-the-pod/id1638194766
Wheat Acres in the South
This article was written by J. MARK WELCH
Professor and Extension Economist Texas A&M AgriLife Extension
The Southern region of the United States is more associated with cotton production than wheat. Yet, from 2005 to 2022, a time of high grain prices associated with increased production of biofuels, wheat planted acres in the South, on average, have exceeded that of cotton (Figure 1). Wheat acres and production in the region are dominated by Oklahoma and Texas (Figure 2); Texas also leads cotton planted acres, by far, followed by Georgia (Figure 3). In 2022, the South will account for about 20 percent of total U.S. wheat production (USDA, NASS, Crop Production, August 2022).
The year with the most wheat acres in the South in this ‘biofuel era’ is 2013 at 17.3 million. That year saw the highest plantings in seven of the fourteen states in the region for this period of time: Alabama, Kentucky, Mississippi, North Carolina, South Carolina, Tennessee, and Virginia. Oklahoma and Texas are not on this list. Acreage increases across multiple states can add up to make a significant difference in total wheat area in the region.
Wheat is a crop with relatively high yield potential across the South. This becomes especially important when drought impacts major producing states. With drought lowering harvested acres and yields, Oklahoma and Texas are projected to produce about 109 million bushels of wheat in 2022 from 4 million harvested acres and 9.8 million acres planted (Figure 4). The states of Kentucky, Tennessee, North Carolina, Maryland, and Virginia combined to plant about 2 million acres of wheat for 2022 and will match the production total in Oklahoma and Texas. Kentucky’s production alone is 90 percent of that of Texas.
Years with high wheat acres in the South tend to be associated with years of relatively low cotton acres (Figure 5). Crop acres are positively correlated with the price received in the previous season (Figures 6 and 7). Wheat acres are negatively correlated to higher cotton prices (Figure 8). Additionally, wheat acres tend to go up following years of high abandonment of cotton in Texas and Oklahoma (abandonment rates in other Southeastern states are minimal) (Figure 9). In 2022, Texas and Oklahoma farmers planted 8.6 million acres of cotton, only to harvest 2.8 million (a harvested-to-planted percentage of 33 percent).
Looking ahead to 2023, what are wheat acreage prospects in the South given:
- record high wheat prices[*]
- record high cotton prices*, and
- high cotton abandonment in Texas and Oklahoma?
A regression model composed of these independent variables and recent trends in wheat planted acres shows that wheat planted area:
- is trending lower,
- goes up when the price of wheat the previous year goes up,
- goes down when the price of cotton the previous year goes up,
- goes up when percent of cotton harvested in Texas and Oklahoma the previous year goes down.
Based on these variables, the model estimate of wheat acres in the South for 2023 is 14.4 million, up from 12.7 million acres planted in 2022 (Figure 10). Many factors will shape farmers’ planting decisions in 2023, among them persistently high input costs, lingering drought, returns from other crops such as corn and soybeans, and price prospects given global economic and geopolitical turmoil and uncertainty. This model suggests that significant factors are in place for an increase in wheat acres in 2023, maintaining wheat as an important crop enterprise in the South. READ MORE
EXPO!!!
The Sunbelt Ag Expo was this past week where the Farmer of the Year and Southeastern Hay Contest was awarded. It you would like more information on please go to https://sunbeltexpo.com/foty/ and the https://site.caes.uga.edu/sehaycontest/


The Drought, Exports, and Cotton Prices
Darren Hudson, Professor and Combest Endowed Chair for Agricultural Competitiveness Texas Tech University
The drought of 2022 in Texas has taken its toll on U.S. cotton production, with USDA forecast 13.8 million bales (mb) (or 3.7 mb lower than 2021). Lower output equals lower exports, with current forecasted exports of 12.5 mb, down 14% from the previous year (See Figure 1). That also means lower ending stocks, currently estimated at historically low levels of 2.8 mb. But the drought (and higher than average price) has not slowed exports, with roughly one-half of expected production already sold or shipped where China has been the largest destination so far this year.
USDA data show the typical inverse relationship between crop size and farm price. And even though expected farm price is below last year, if realized, would be the second highest average farm price on record.
But there are concerns. Recent price action in the 22 and 23 December contracts have shown considerable weakness relative to earlier in the year. Recent lower prices would be expected to stimulate buying. In fact, exports do show strength. But there appears to be substantial selling pressure any time price moves up. And the market appears to be inverted with nearby prices above prices in out-month contracts suggesting current demand above future demand.
What is perplexing is the relatively low DEC23 price (currently in the mid-70 cents per pound range). That price level is insufficient to cover anticipated costs in many regions of the U.S. Also, relative to grains, the price for the DEC23 contract appears to signal fewer cotton acres next year. There is still time for prices to realign, but the market may be signaling lower anticipated cotton demand in 23 driven by higher apparel prices (and general inflation). For now, cotton is moving globally, and the US is likely to end the 22/23 marketing year with historically empty warehouses. READ MORE

If you have questions please contact your local county Extension agent.