-

Please “save the date” for the Carolinas Climate Resilience Conference to be held in Durham, NC on October 26-28, 2020. For more information, please go to the conference web page at https://cisa.sc.edu/ccrc/.
Posted in: Events -
The latest text summary of climate information for the Southeast is now available at https://sercc.com/SoutheastRegionAnnualClimateReport2019.pdf.
Posted in: Climate summaries -
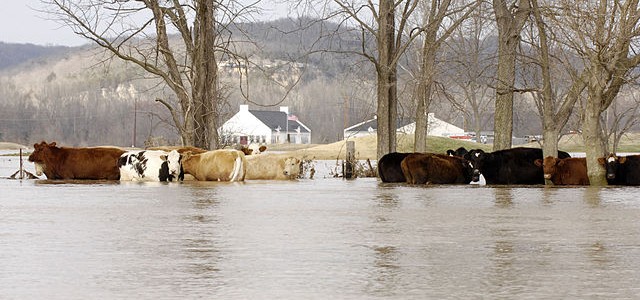
Southeast AgNet posted a story earlier this week about the problems that flooding rains are causing for livestock producers in Alabama. You can learn more about how it is affecting hay and pastures as well as livestock health at https://southeastagnet.com/2020/01/04/heavy-rains-flooding-affecting-livestock/.
-

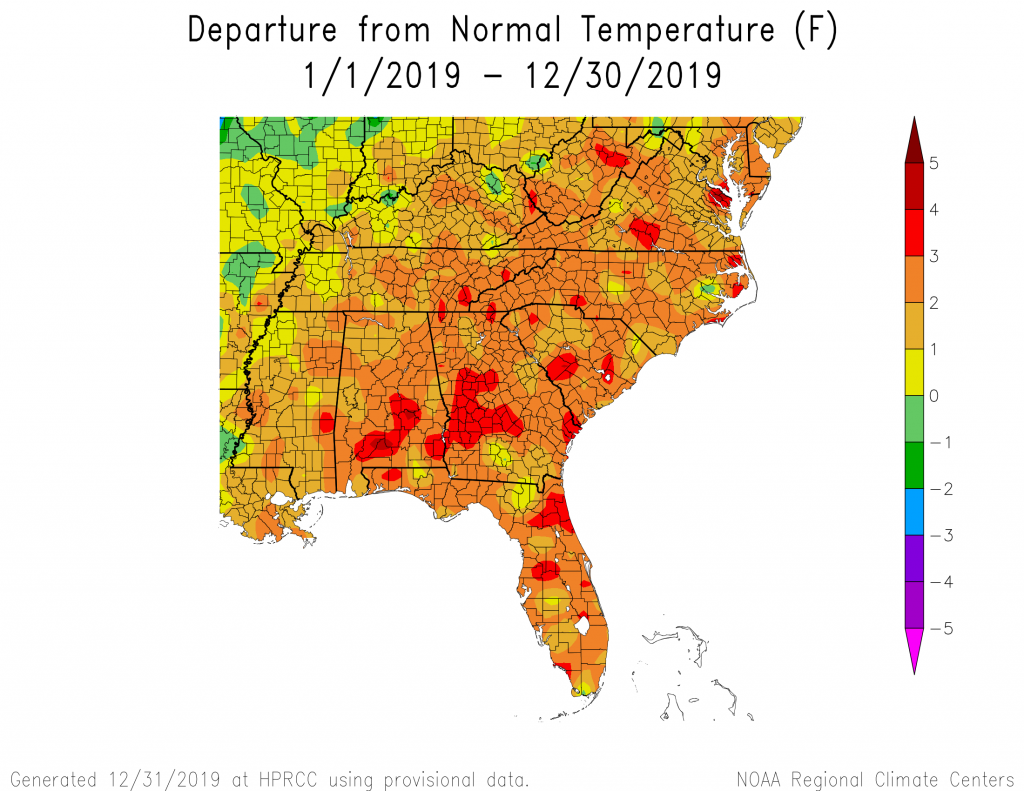
The annual climate summary for the US is now available and shows that for the Southeast as a whole as well as the states of Georgia and North Carolina, 2019 was the warmest year on record. Other states in the Southeast were in the top three warmest. Precipitation was in the middle third of all…
Posted in: Climate summaries -

Climate summaries are now available for North Carolina and for the Southeast US for 2019. You can read them at the links below. I will write a separate post on what the entire US summary shows. North Carolina Southeast Regional Climate Center
Posted in: Climate summaries -
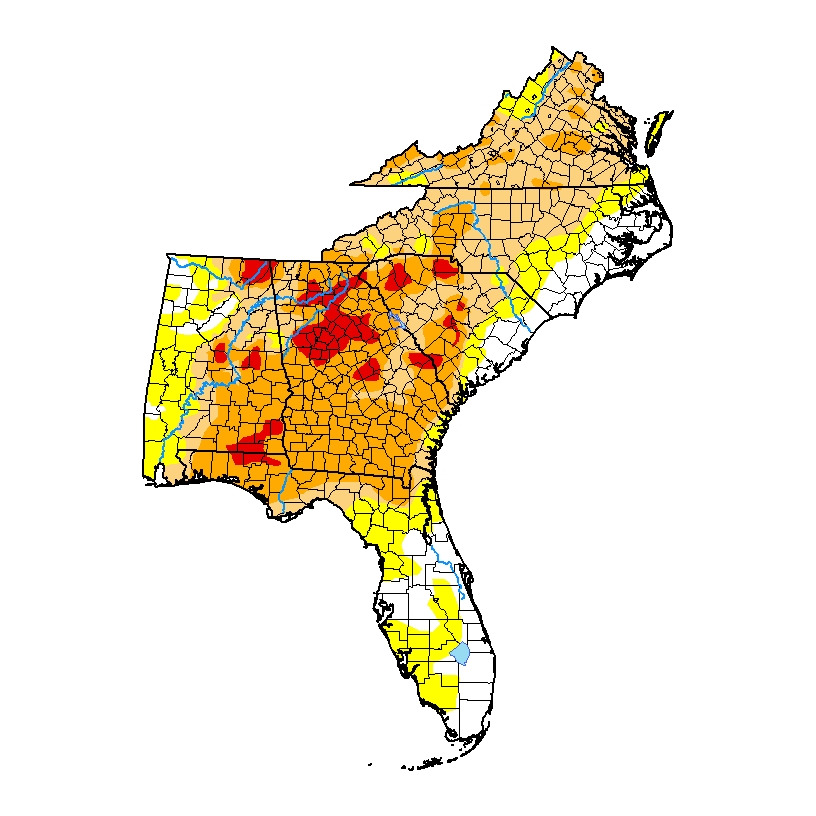
Do you use the weekly US Drought Monitor in your work, or monitor it for changes in the drought status? Do you use it to help your producers get financial assistance when a severe drought hits? If so, you may be interested in this upcoming workshop on the US Drought Monitor, how it is put…
-
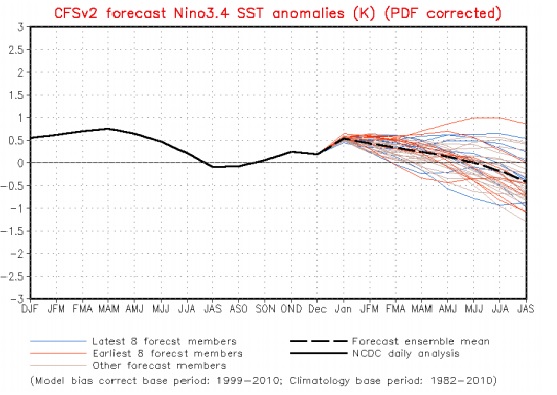
The latest weekly ENSO outlook was released by NOAA’s Climate Prediction Center today and show that while the sea surface temperatures in the eastern Pacific Ocean are quite warm at the moment, neutral ENSO conditions are expected to continue through Northern Hemisphere winter (70% chance) and spring (65% chance). In neutral conditions there is no…