Sources of weather and climate data
-

Here’s some interesting information about a source of weather forecast data that might be useful for farmers across the Southeast, from Mark Hoffmann at our sister UGA Extension blog on viticulture. Note that the six-day forecast for humidity, wind, dew/frost and other variables will be good for planning field work for many crops, not just…
-
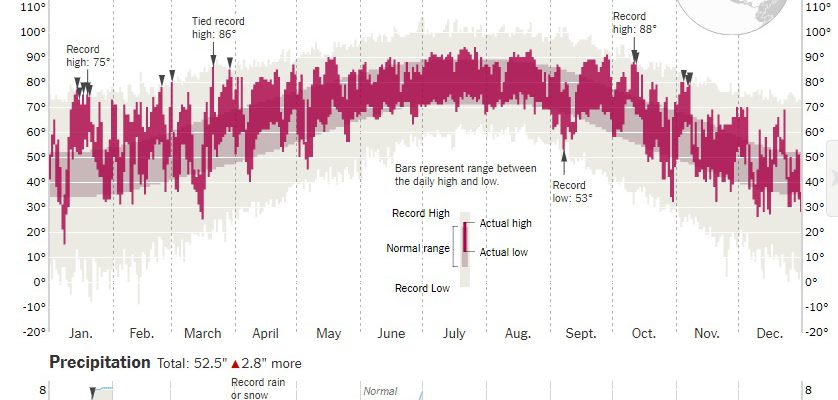
Here is a fun tool from the New York Times. You type in your city (there are 3800 possibilities) and see a daily record of high and low temperature and monthly accumulated precipitation, with annotations for records. I have it set to Atlanta but you can easily check your own city. Try it at https://www.nytimes.com/interactive/2018/01/21/world/year-in-weather.html#atl.
-
“Wind chill” is a measure of how much colder you would “feel” if cold air is blowing on you with a particular wind speed. The higher the wind speed and the lower the temperature, the colder the wind chill temperature. The colder the wind chill, the faster you could experience hypothermia and suffer severe health…
-

The USDA has announced the availability of a new GIS-based plant hardiness zone map, which is zoomable and is based on 1976-2005 data. You can read more about it at https://planthardiness.ars.usda.gov/PHZMWeb/AboutWhatsNew.aspx. You can access the map at the link above by clicking on Interactive Map on the top menu or go directly to it at https://planthardiness.ars.usda.gov/PHZMWeb/InteractiveMap.aspx.
-
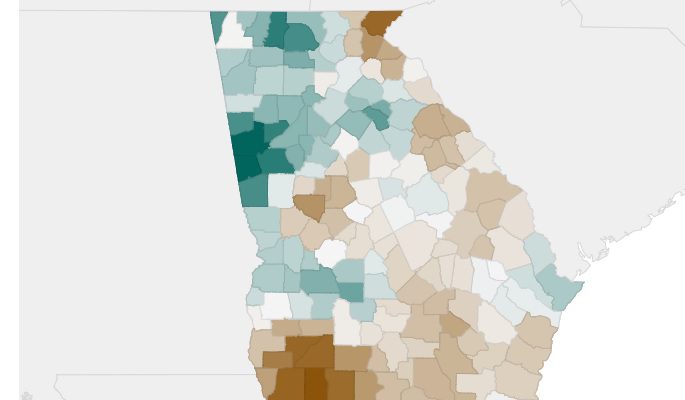
For the first time, the National Centers for Environmental Information (NCEI) has maps of temperature and precipitation anomalies available by counties. In the past you could get it by state, region, and climate division, but nothing smaller. This might be useful for those who are interested in county statistics rather than using station data, since…
-

Here’s an interesting statistic from Brad Panovich, meteorologist, on Twitter and Facebook: The last two weeks, from December 25 through January 7, have been the coldest on record for many locations in the Southeast. The ranking map from the Southeast Regional Climate Center shows how widespread the #1 rankings are across the region. You can…
-

If you are interested in looking at long-term trends in climate across the US, this “Beyond the Data” article by Jake Crouch does a great job of explaining where to get trend data and how to interpret it. I use NCEI’s tooks like the “Climate at a Glance” tool all the time when I give…