Climate summaries
-
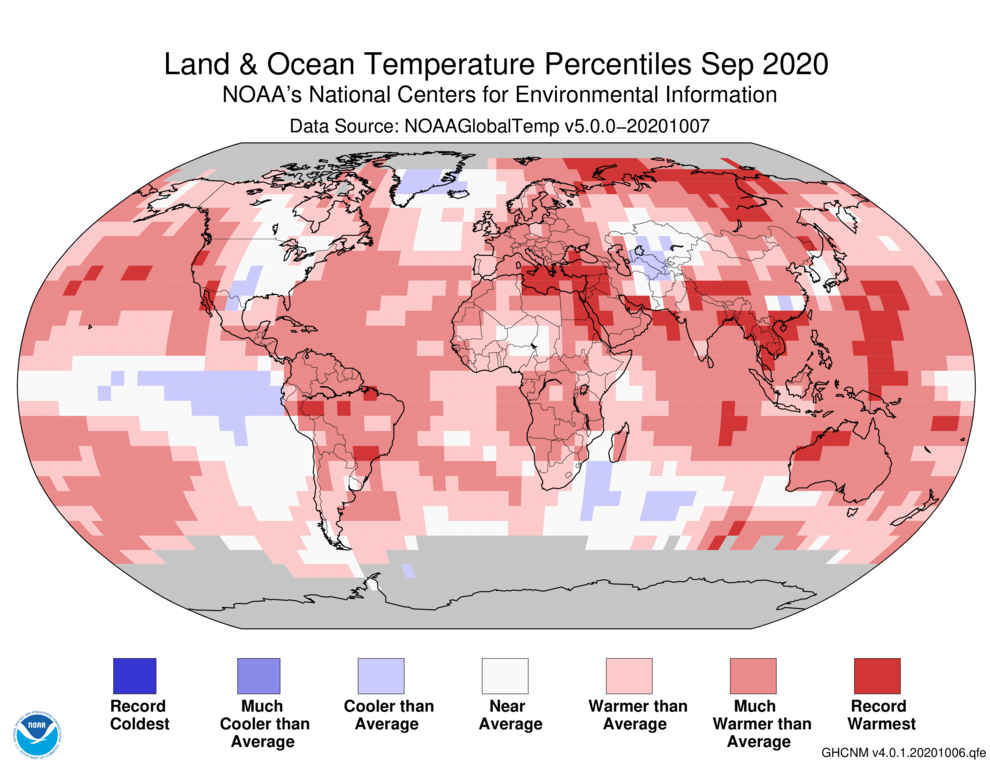
According to the latest global climate summary from NOAA, this past month of September 2020 was the warmest September on record since 1880. In fact, all of the top ten warmest Septembers globally have occurred since 2005. The earth is on track to have one of its top three warmest years on record. You can…
Posted in: Climate summaries -

On Tuesday at 10 am EDT, the Southeast Climate Monthly Webinar will present information on the current state of the climate, including drought, tropical weather, and impacts on water supplies and agriculture. This month also includes a fall foliage update. You can register and join the webinar at https://register.gotowebinar.com/rt/1287144793876293389.
-

The latest monthly climate summary for the Southeast covering September 2020 is now available from the Southeast Regional Climate Center. You can read it at https://sercc.com/SoutheastRegionMonthlyClimateReportSeptember2020.pdf.
Posted in: Climate summaries -
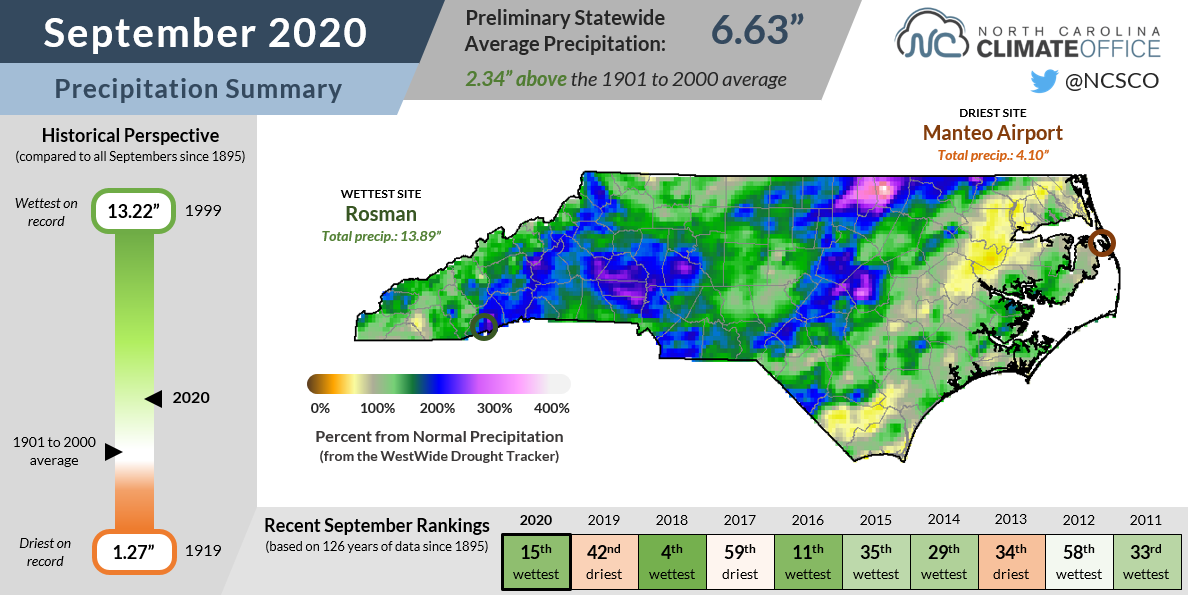
The monthly climate summary for September 2020 for North Carolina is now available at https://climate.ncsu.edu/climateblog?id=325&h=5666e5c1.
Posted in: Climate summaries -

Another month has come and gone and so today we will look at the preliminary climate summary for September 2020. The maps from the High Plains Regional Climate Center show that average temperatures were near to slightly above normal across most of the region. If you break it down into maximum and minimum temperatures, you…
Posted in: Climate summaries -
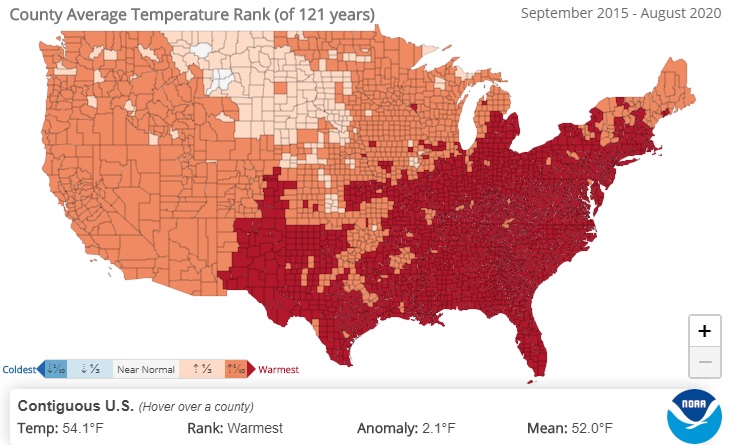
Deke Arndt of the National Centers for Environmental Information posted a map today which shows the 5-year average temperature ranking by county (September 2015 to August 2020) for the continental US. It shows that for large parts of the country including most of the Southeast, this has been the warmest 5-year temperature since records began…
-
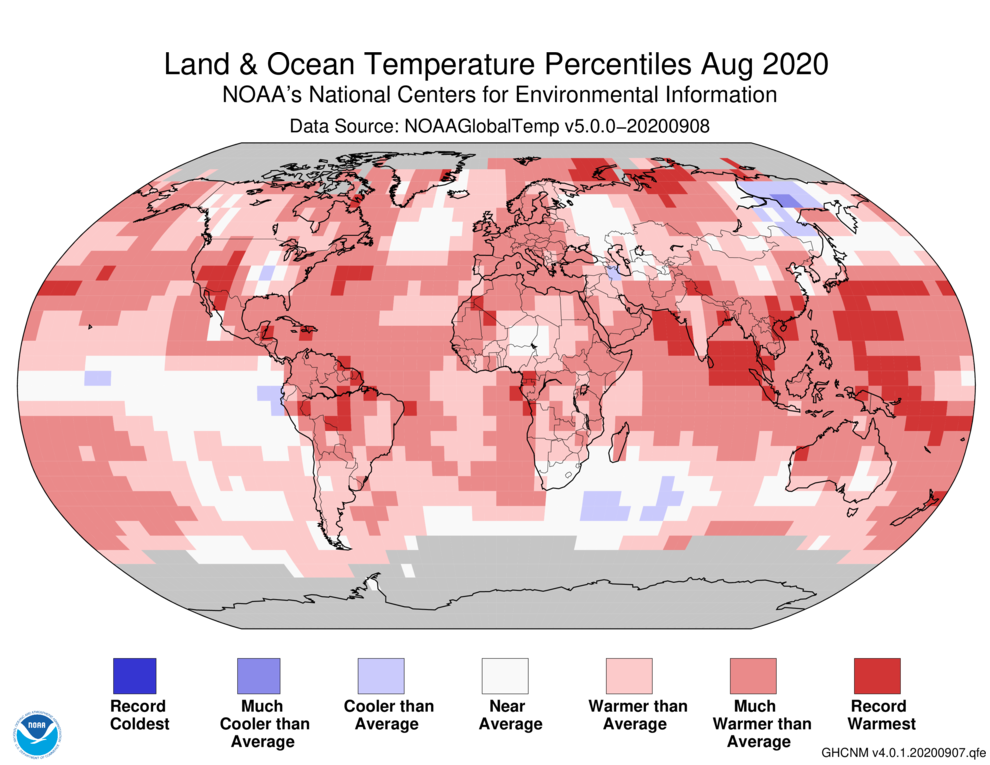
The latest global climate summary for August 2020 was released by NOAA earlier this week. It shows that this past August was warmer than 2019 but still not quite as warm as the warmest August, 2016, for the globe. For the June through August period, which is Northern Hemisphere summer, it was the third warmest…
Posted in: Climate summaries