Pam Knox
-

In the news today I heard that the FDA is recommending that we test all blood donations for the Zika virus, which is carried by mosquitoes and can cause severe birth defects in babies if the mother gets infected during pregnancy. Zika is just one of several severe diseases that is carried by mosquitoes in…
-
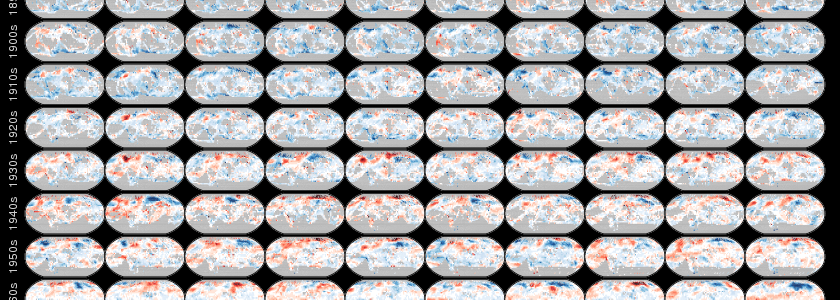
The use of small multiple images is one that allows you to look at changes in the individual images differently since the format of each image is the same. I love this collection of small multiples of global temperature because not only does it show changes in temperature over time (see how warm the earth…
Posted in: Climate science -

The US Environmental Protection Agency has announced that fact sheets for each state describing how climate change is affect that state are now available. You can see the list and download them at https://www3.epa.gov/climatechange/impacts/state-impact-factsheets.html.
-
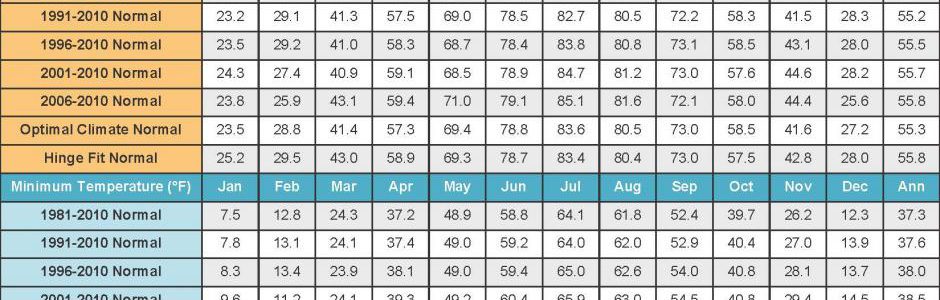
NOAA announced that they have new and expanded tables of normal temperature and precipitation values now available on their web site. Typically, climatologists consider 30 year averages to be “normal” climate conditions, and they are updated every ten years. The current 30-year normal period is 1981-2010. But some groups like utilities want normals over different…
-
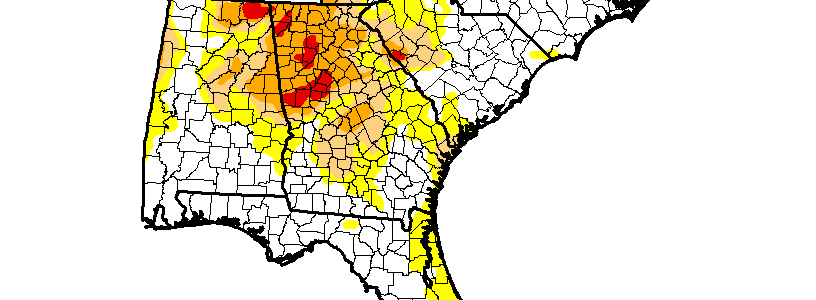
Scattered rain showers across the Southeast improved the dry conditions in the worst-hit drought areas this week. The latest Drought Monitor shows that extreme drought was removed from northeast Georgia as well as reduced in northern Alabama and metro Atlanta. Overall, the area of dry conditions increased slightly, mostly along the east coast of Florida.…
Posted in: Drought -
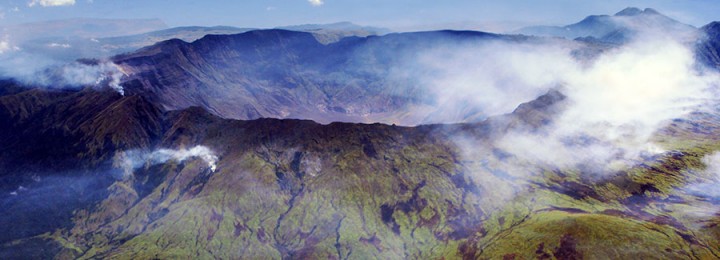
The Capital Weather Gang has a great article this week on the impacts of the “Year without a Summer”, which was caused by the eruption of Mount Tambora in Indonesia in 1815. After a year the sulfuric acid droplets in the stratosphere had spread out enough to seriously decrease the sunlight and incoming solar energy,…
Posted in: History -
CLN and ANREP Climate Science Initiative (CSI) Join Forces for a New Webinar Series The Climate Learning Network has teamed up with ANREP CSI to present a new fall webinar series which kicks off with The Northeast Regional Climate Hub’s Erin Lane and our own Dan Geller discussing new efforts in online climate resources. CLN/CSI…
Posted in: Events