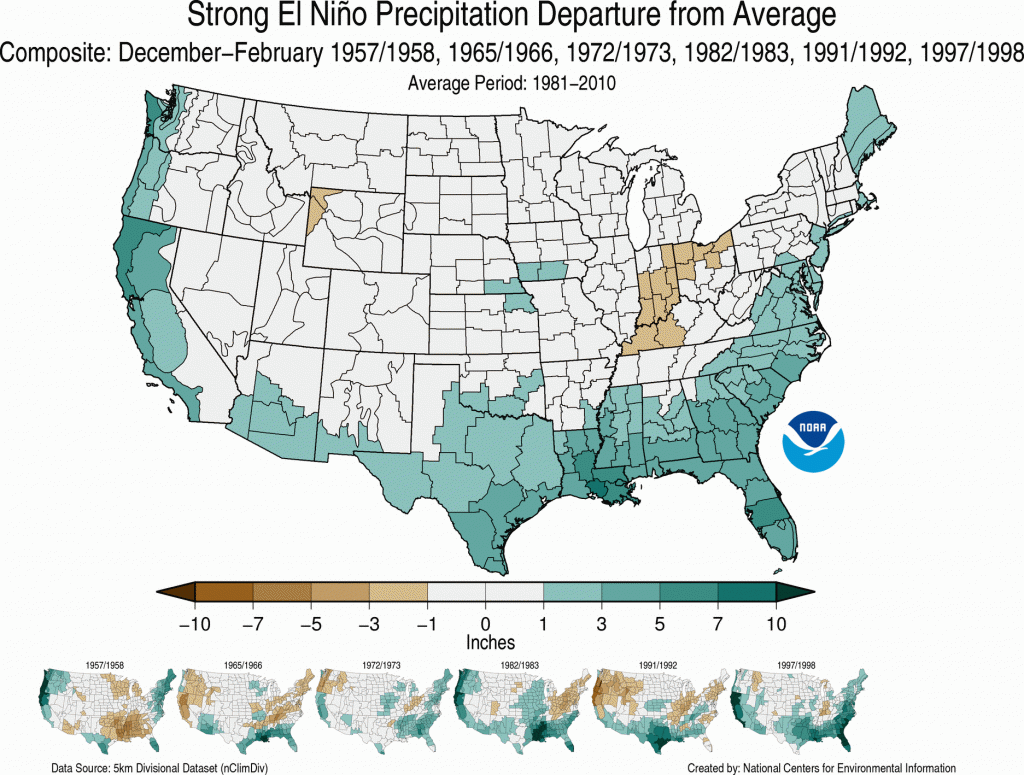
NOAA’s National Centers for Environmental Information published a new article this week on the historical comparisons between the current strong El Niño and previous ones. You can read it at https://www.ncdc.noaa.gov/monitoring-references/dyk/elnino-2015-2016.
The article displays the difference between each of the historical El Niño years so you can see the year to year variation in where the most rain fell. It also provides an estimate for how far above normal the rainfall this winter (December-February) is likely to be. For most of the Southeast, they predict an increase of 3-5 inches of precipitation over the three-month period. Since most months get about 4 inches on average, that would add roughly an extra inch per month, or 25 percent above normal rainfall.
However, keep in mind that in any individual event, the rainfall patterns can vary quite a bit. The most likely areas to see above normal rainfall are south Alabama and Georgia and the Florida peninsula. Other areas vary from one even to the next.