Now that March is upon us and the atmospheric pattern has shifted into something that is bringing more spring-like weather to the Southeast, it’s time to think about planting. And that means thinking about the last frost of the winter.
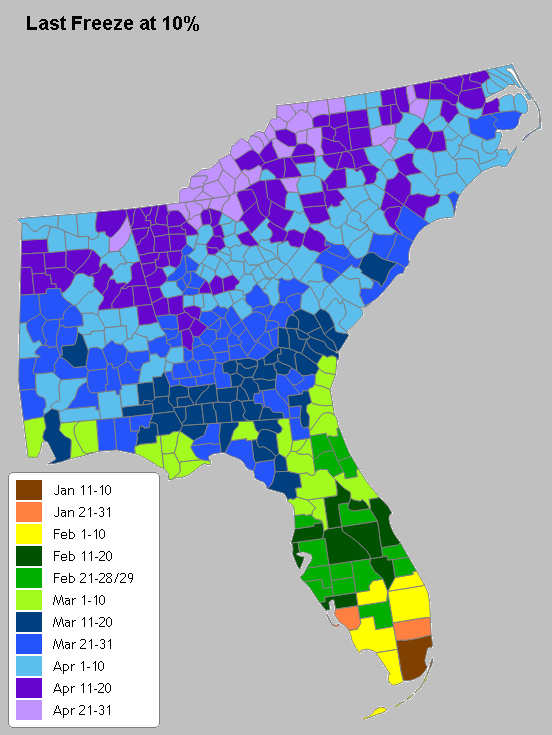
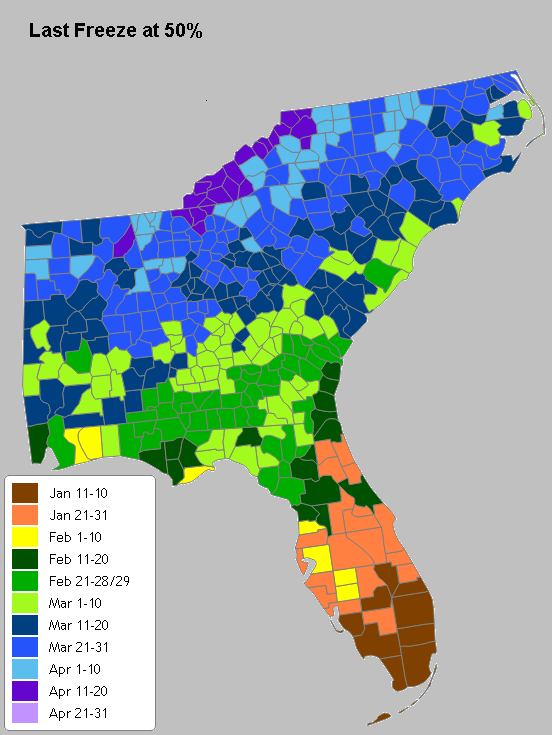
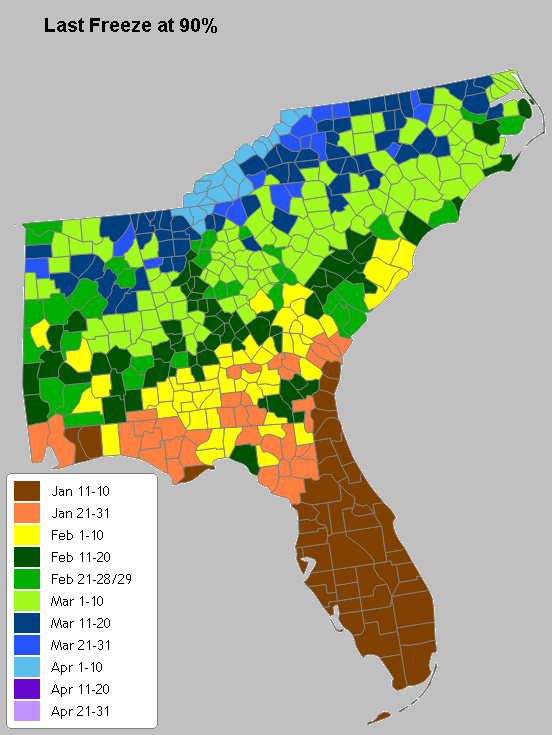
AgroClimate has a tool which shows the last frost date by county for the Southeast. The 50 percent map shows the average date for the last frost, while the 10 percent map shows the date that one in ten years will see a frost, and the 90 percent map shows the date for which in just one out of ten years the last frost will come early (or in other words, in 9 out of 10 years the last frost will come later than this date). The maps below show the dates for 32 F. You can find the tool at https://agroclimate.org/tools/Freeze-Risk-Probabilities/.
If you need the information for a different temperature threshold, then a good source of information is the Southeast Regional Climate Center. You can go to their web page www.sercc.com and pick “Historical Climate Summaries” from the “Climate Data” menu at the top. Pick your station and then look for “Spring Freeze Probabilities” on the left menu. Here is the graphical output for Tifton, GA.
What this shows is that for Tifton, for a temperature of 32 F (orange line) at the 50th percentile (for the average date), the date is about March 10. You can click on the link for tabular data to get a table of numbers instead of the graph shown here. Keep in mind that this is for the period of record for the station, and that last dates for spring freeze have been trending earlier in the season in recent warm years. If you have a different source of freeze information that you like to use, please let us know!