Farm Industry News published a very interesting panel discussion on the future of farming across the world in the face of changing climate, consumer demands, and other challenges. You can find it at https://farmindustrynews.com/precision-farming/future-farming. One of the themes that come up in the discussion over and over again is the important of water availability and the need to manage water resources wisely.
Using the Climate at a Glance tool from the National Climatic Data Center (https://www.ncdc.noaa.gov/cag) you can see the long-term trends in temperature, precipitation and drought across the Southeast. What the graphs show is that the total annual precipitation is increasing very slowly across the Southeast (you can use the link to drill down to your own location). Temperature is much more variable but has been increasing overall and is increasing at a higher rate since the 1960’s. The Palmer Drought Severity Index has a slight trend to more drought. But the more interesting thing to note on the drought graph is the “benign period” from about 1958-1980 when there was practically no drought in the Southeast. This is the same time period that temperatures were the coolest. So with increasing temperatures, we can expect to see more frequent droughts even if the precipitation is not changing much. This is due to increases in evaporation and evapotranspiration that occur at higher temperatures. That makes effective use of water even more important in the future than it is now.
 Annual precipitation
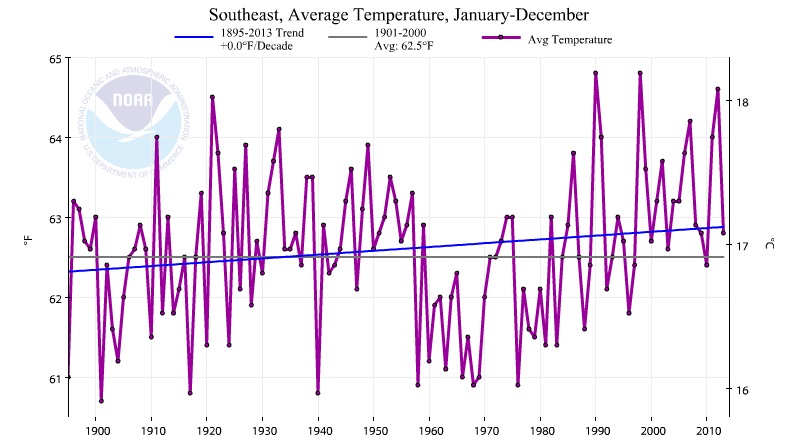 Annual temperature
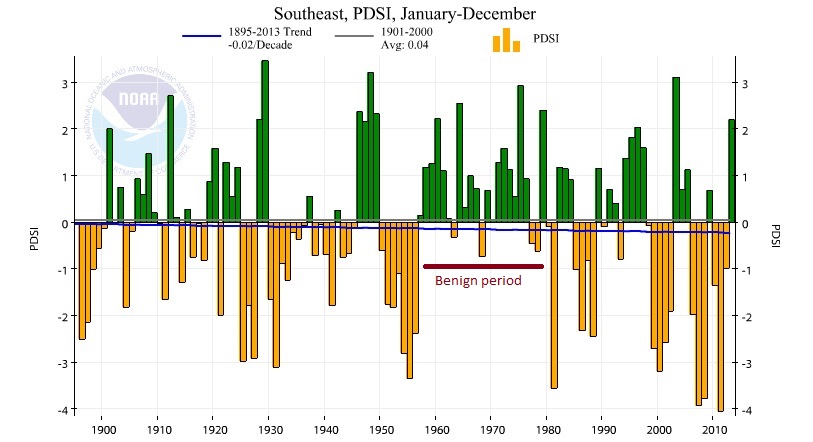 Annual Palmer Drought Severity Index