I was recently invited to attend a meeting held by the Colquitt County Chamber of Commerce. The topic of how much agriculture means to the county was one of the topics of discussion. The University of Georgia Center for Agribusiness and Economic Development publishes a report called the Farm Gate Value Report.
How is this data compiled? This report relies on Cooperative Extension personnel to provide production information. Each year, a survey is distributed to Extension offices for completion by the county agent. For crops, individual agents are asked to supply county acreage and yields. A suggested price for each crop (determined by Extension specialists) is provided. Individual agents have the option of adjusting the price based on county conditions. Agents are also provided acreage data for row crops, fruits, nuts, and vegetables from the Farm Service Agency (FSA) for guidance. For livestock, inventory numbers are requested, to which a formula is applied for calculating the average production for the year and the value of production for the county. The CAED (Center for Agribusiness and Economic Development) supplements the agent-submitted data with statistics from other sources for the value of timber, crop insurance, and government payments.
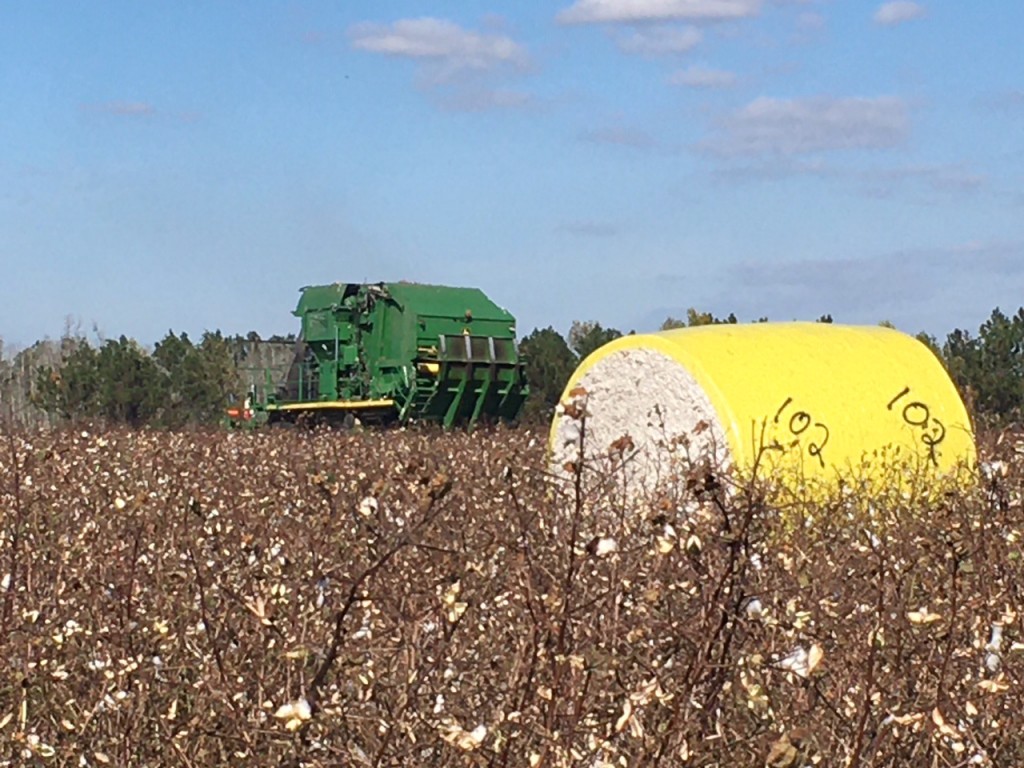
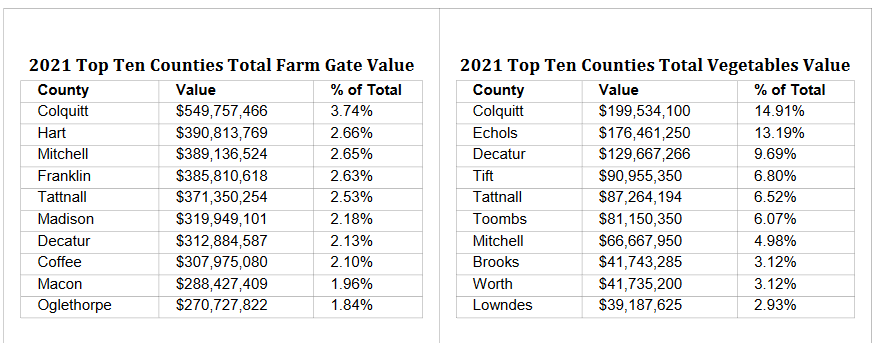
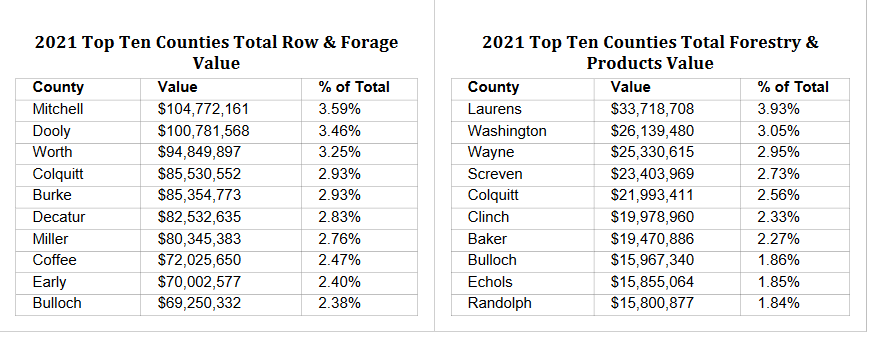
Let’s look at some of the figures from the 2021 Farm Gate Value report. Colquitt County generated over $549 million in farm gate value, which is the highest in the state. The Colquitt County vegetable industry generated almost $200 million, and row crops generated over $85 million in farm gate value.
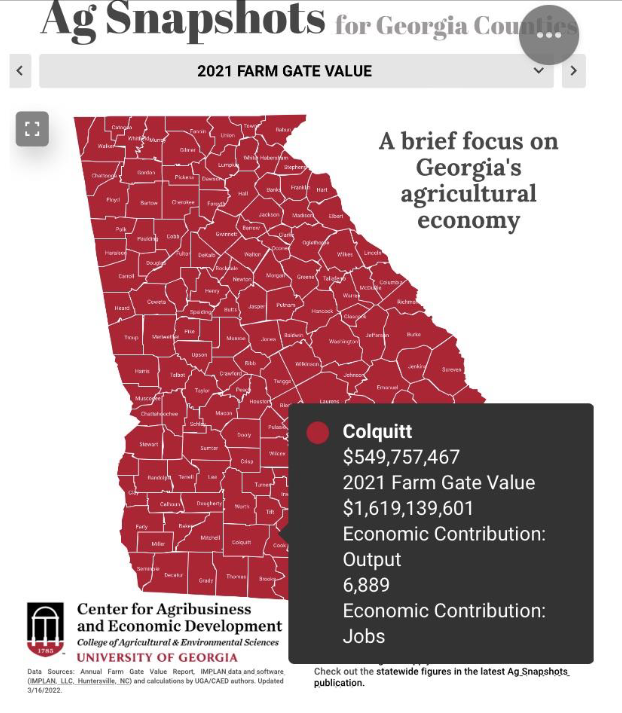
What does agriculture bring to the community? Dr. Sharon Kane, Agribusiness and Community Development Economist with the UGA Center for Agribusiness and Community Development, puts together data that illustrates the impact of agriculture in communities across the state. The data is called Ag Snapshots for Georgia Counties. Ag Snapshots provides the output and jobs supported by food and fiber production, which include the directly related industries along the supply chain—the economic contribution. Check out the statewide figures in the latest Ag Snapshots publication. The figures for Colquitt County from Ag Snapshots are highlighted below.
There is also an interactive page that contains maps, graphs, tables, and other kinds of visualizations related to a topic. You can use the filters at the top or click anywhere on the visualizations to update the data displayed on the page.
https://georgiadata.org/topics/agriculture/farm-gate-value
If you have questions about this subject contact your local county agent.