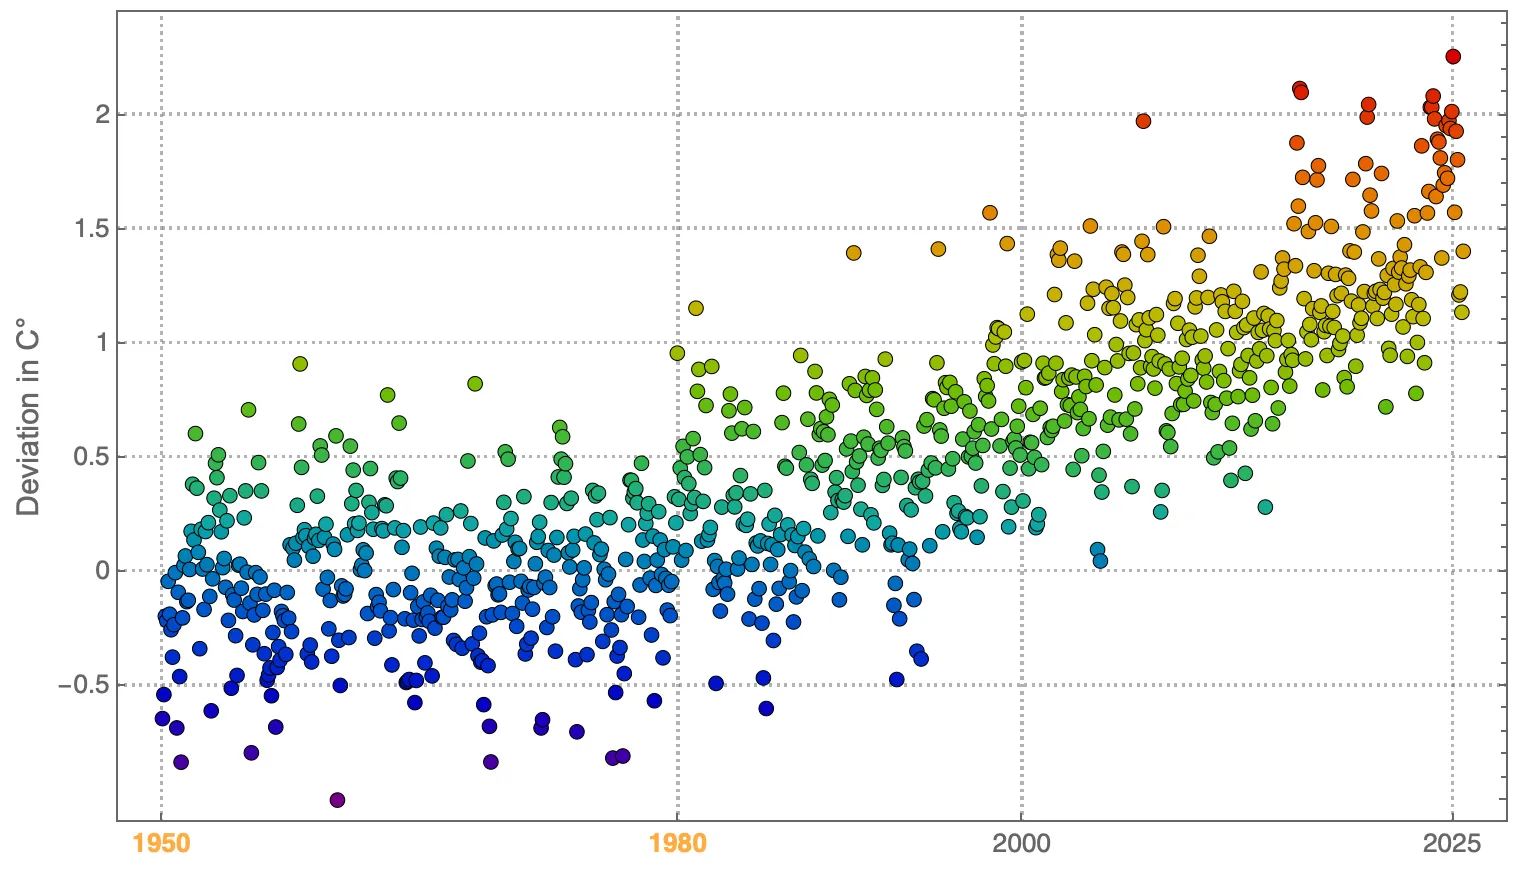
Here’s a different way to depict the increase of the earth over time. According to the creator, Harlan Brothers, his YouTube video presents “a visualization and sonification of global temperature anomalies over land. The deviations are based on the average temperature from 1950 to 1980. Each note (and point on the graph) represents one month. Where there are consecutive data points of the same value, only the first note sounds. In these cases, the amount of deviation is roughly the same. The short bass motif marks 2-year intervals.” You can see and hear it at https://www.youtube.com/watch?v=5yV38_biY44 and read more about his creative process at https://sciencespectrumu.com/climate-blues-8002672cffeb.