Over the past few weeks I have been introduced to several new web sites which provide graphical and/or map-based climate information that might be of use to you. I have not checked them out in detail yet, but wanted to let you know about them so that if you are interested you can see if they provide information that would be useful to you.
NOAA Climate Explorer: Read more here or go right to the tool at https://crt-climate-explorer.nemac.org/ . Provides maps and graphs of historical and projected climate variables for any county in the contiguous US.
Climate Toolbox: https://climatetoolbox.org/tool/historical-climate-dashboard . Generates a dashboard of real-time climate metrics for monitoring a location in the contiguous US.
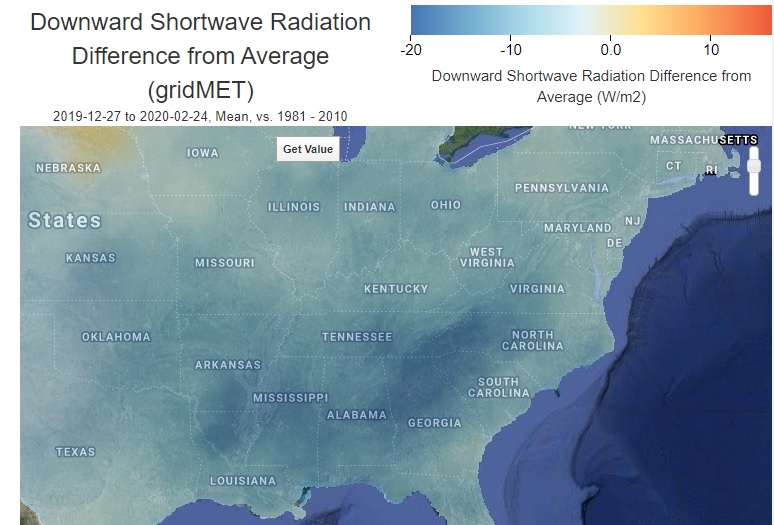
Climate Engine: https://climateengine.org/ . Allows you to analyze and interact with climate and earth observations for decision support related to drought, water use, agricultural, wildfire, and ecology using on-demand cloud computing. For example, the map below shows how the rainy weather we have had in parts of the Southeast have reduced the amount of solar radiation that we would usually expect to get.