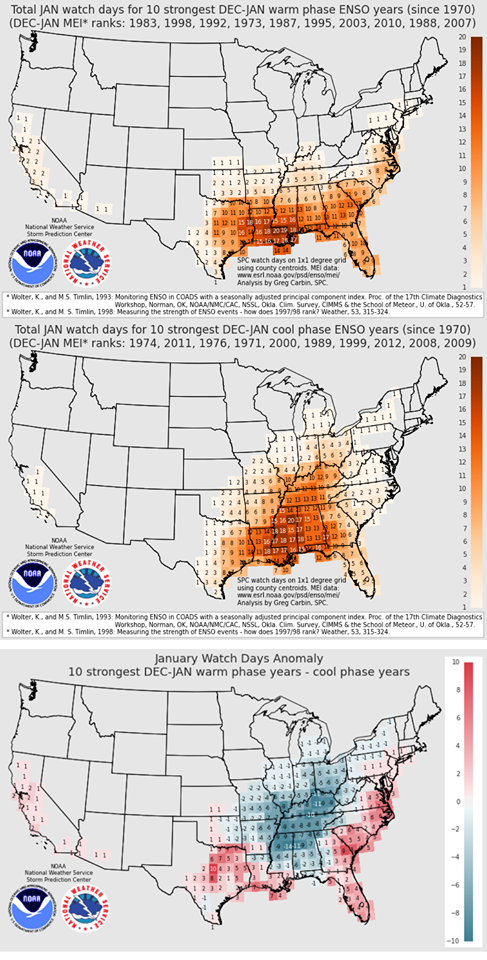
From the Louisiana State Climate Office: This interesting graphic from the Storm Prediction Center shows how El Niño and La Niña may influence local severe weather. The top map shows the average number of January watch days during the 10 strongest Dec-Jan El Niños as rated by the MEI, or Multivariate ENSO Index. The middle map shows the same except during La Niñas, and the bottom map shows the difference in average January watch days between the strongest El Niño months and strongest La Niña months.
Here in the Southeast, it means that for Georgia, Florida and the Carolinas, the strongest El Niños tend to have more severe weather watches than in La Niña years, while in Alabama and Mississippi, there tend to be more watches in strong La Niña years than in strong El Niño years. However, the two top maps show that you can get severe weather in the Southeast regardless of ENSO phase, so be prepared!