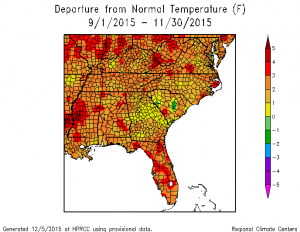
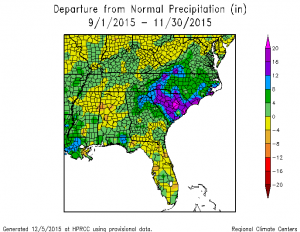
Sometime later this week NOAA should publish the statistics on fall climate for the US. The maps below show the temperature and precipitation departures for the Southeast from the High Plains Regional Climate Center. While temperatures were a bit above normal almost everywhere in the Southeast, the real story is the very wet conditions across most of the region, particularly in South Carolina. It seems likely that this will be one of the ten wettest falls on record, although we will have to wait for official records to be sure.
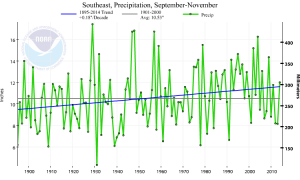
How do these compare to past falls? I’ve plotted the values for fall temperature and precipitation below, along with trend lines to indicate what long-term changes are seen in the data. You can make your own at https://www.ncdc.noaa.gov/cag.
The graphs show that while fall temperatures are showing no trend in temperature over time, the fall precipitation is increasing over time for the full period of record, although the trend for the last 20 years has been negative. If you compare this to other seasons, you can see that while winter and spring have very little trend, summer is getting drier over time. None of them are increasing in precipitation like fall.
This may be bad news for farmers, who are usually ending the growing season in fall and need dry weather to harvest pecans, peanuts, hay, and cotton. This does not mean that we will see massive flooding like what happened in South Carolina every year, but wetter conditions are likely to happen more often if this trend continues. The trend does not appear to be linked to tropical storm activity. And fortunately, this is a slow increase, not a rapid rise, so that will give farmers time to adapt using new management practices.


