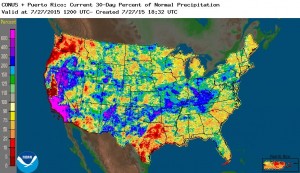
The latest NWS 30-day precipitation maps from https://water.weather.gov/precip show how wet California has been this year compared to normal. The two maps below show the departure from normal and the percent of normal since June 26, 2015. While the Southeast has been slightly below normal during that time period, California has received 1-2 inches of rain. Since this time of year they typically get no rain at all, this amounts to more than 600 percent of normal (basically you are dividing by zero, which gives you some funky results from a percentage standpoint).
The unusual rainfall is linked in part to the strong El Nino which is currently occurring in the Eastern Pacific Ocean. You can see a CBS News article on this at https://www.cbsnews.com/news/heavy-storms-in-california-signify-return-of-el-nino/?ftag=YHF4eb9d17. Years with strong El Ninos often produce a lot of rain on the West Coast, which is good news for farmers desperate for moisture. It could help to refill reservoirs and improve soil moisture. However, many months of above normal precipitation are needed to eliminate the drought conditions there, so even one good winter will not erase the current drought.
Meanwhile, the wet conditions in the central part of the US are causing a variety of adverse impacts on farmers. I will detail some of those in a future blog post.

