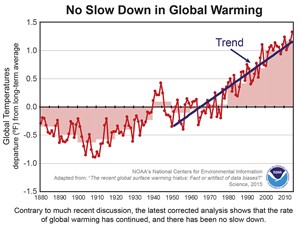
The journal Science published an article today which shows an updated historical climatology of global temperatures produced by NOAA. The newly revised temperature timeline shows that unlike previous analyses, the new timeline shows that there has been no substantial slow-down in the rate of temperature increase on the globe. The previous theory about the “hiatus” in temperature rise has gotten a lot of attention by some skeptics of global warming. Scientists have had a difficult time explaining why the temperature rise appeared to be slowing down. Theories about heat being absorbed by the deep ocean and long-period natural cycles have been discussed as possible reasons.
In the Science article, NOAA scientists showed that much of the supposed “hiatus” in warming was not real but was due to a change in the way they measure ocean temperatures. Since 75 percent of Earth is covered by oceans, this has a big effect on estimates of global temperature. In the oldest records, sea surface temperatures were taken from ships. Now, more measurements are taken from buoys. The scientists discovered that when you compare the ship temperature and the buoy temperature side by side, the buoys were reading colder than the ship temperatures. As the number of buoys has increased over time, the use of more buoy temperatures has made sea surface temperatures to appear to be cooler. To make the temperature record consistent over the entire period from 1880-present, the temperatures must be adjusted to account for changes in instruments. Satellites also measure sea surface temperature, but they measure the “skin” on the top of the ocean rather than a measurement at ship or buoy depth, so you can’t use satellite temperatures effectively since they measure only the very top millimeter of the ocean.
Adjustments to the long-term temperature record are nothing new, and other groups like economists also use the same methods of revising preliminary data to correct for updated information (for example, the unemployment rate or economic indicators you might read about in the Wall Street Journal). Temperature is not the only climate variable that must be adjusted. For example, traditional rain gauges like the NWS 8 inch diameter standing rain gauge catch rainfall differently than the tipping bucket rain gauge that is often used by automated weather stations. The tipping bucket gauges have a funnel which directs rain into a tipping device like a see-saw which tips when the “bucket” on one side fills up. In heavy rain, the device cannot tip fast enough to keep up with the flow of water, and so tipping bucket gauges often undercount rainfall when the intensity is high, like in a thunderstorm downburst. If you tried to combine records from these two types of gauges, you would appear to “change” the climate just by changing from one instrument to another.
If you are interested in reading more about this story, here are two links to stories published today. Many more are sure to come.
