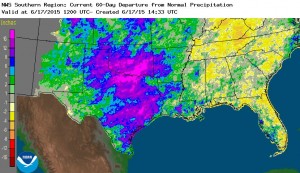
In yesterday’s post I pointed to a composite map from Florida State Climatologist David Zierden showing that on the average, May and June in strong El Nino years are wet and July and August are dry. This year, the wet conditions have certainly occurred in Texas and Oklahoma, but not in the Southeast, as you can see in this rainfall anomaly map from https://water.weather/gov/precip for the last 60 days.

Composite maps are made up of averages for several events, and each individual event has its own flavor and character. This year, because of the strong high pressure over the Southeast, we may have already moved into the July-August pattern, but it is really too early to say.
If you like to look at long-term forecasts, you can find a bunch of different model outputs at websites such as https://www.tropicaltidbits.com/analysis/models/. These are the raw model outputs from several different weather and climate forecast models going out as much as several months into the future. In general, model results are less believable the farther ahead in time you go, but they can be useful in looking at general patterns over time.
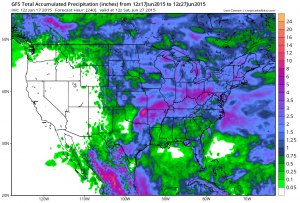
If you are not a meteorologist, the most useful maps for you are likely to be precipitation and temperature near the ground (either 2 meter maps or 850 mb maps, depending on the model). The map below shows the GFS model rainfall accumulation for the next ten days. It shows that most of the Southeast, with the exception of the Florida peninsula and North Carolina, is predicted to get less than an inch of rain, which would certainly be drier than normal. Keep in mind that summer thundershowers can be spotty, and some areas might get plenty of rain even if other areas are missed. The small scale of these storms is not well represented in weather models. If you run through the 2m temperature anomalies, you will also see that most of the next ten days will be above normal in temperature.
Keep in mind that this is one individual model with its own set of simplifications, and that the weather that actually occurs could be quite different, especially ten days out. Don’t use these for detailed management purposes, but as general guidance for trends in what might happen over time, especially if you have longer-term projects that are affected by weather conditions.
