Chill hours (CH) are a sum of hours below 7.2 ℃ (45 ℉) between Oct 1st to next Feb 15th, often used to estimate if the chilling requirement of a peach cultivar is satisfied and ready for timely budbreak in regions (e.g., mid GA) where the spring begins to warm by late February. CH were recorded about a century at Byron, GA, so was data on GA peach production from National Agricultural Statistics Service and state commodity reports. A well-known ancient Chinese proverb says, “using history as a mirror, we may foresee the rise and fall.” Looking into the historical data we may have a glimpse of future chill hours and peach production in the related areas.
The CH received at Byron, GA changed irregularly with an average of 1044 and trended downwards steadily (Fig. 1). The declining trend also corroborated with higher CH average (1087) in the early five decades than the recent five decades (959). Estimated linearly, the averages of CH dropped approximately 11.78% over the years. Declines in chilling time in January and February contributed most to the shortened CH. If this trend continues, there would be more incidences of insufficient chilling. There were five lowest CH, 669, 686, 662, 708, and 520, which occurred in 1949, 1950, 1974, 1999, and 2017, respectively. The interval years between those lowest chilling incidences in 1950, 1974, 1999, and 2017 are 24, 25, and 18, implying extremely insufficient chilling cases might occur more often in the future.
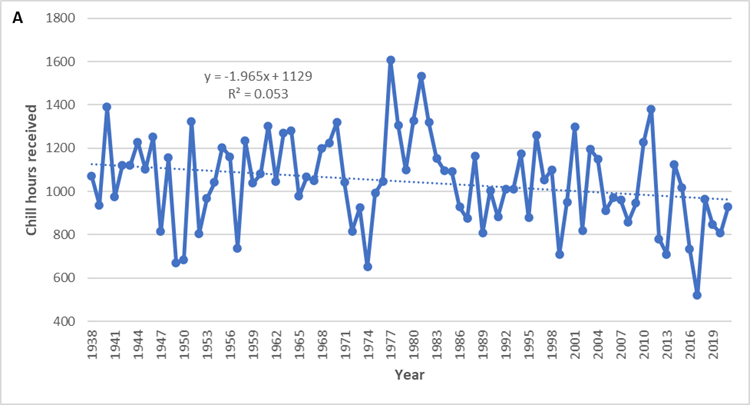
Fig. 1 Chill hours received at Byron, GA, with the declining trendline and equation and R2 value.
The percentages of past years with received CH at Byron approximated a normal distribution (Fig. 2). Using the percentages, the likelihood of future years to receive satisfactory chill hours for a cultivar may be estimated. It is certain the higher chilling requirement does a cultivar have, more often they will encounter chill inadequacy, which probably explains that chilling requirements of many cultivars used in GA commercial production are around 850 CH, to maximize the likelihood of satisfactory chill and reduce the risk of spring frost as they bloom relatively later.
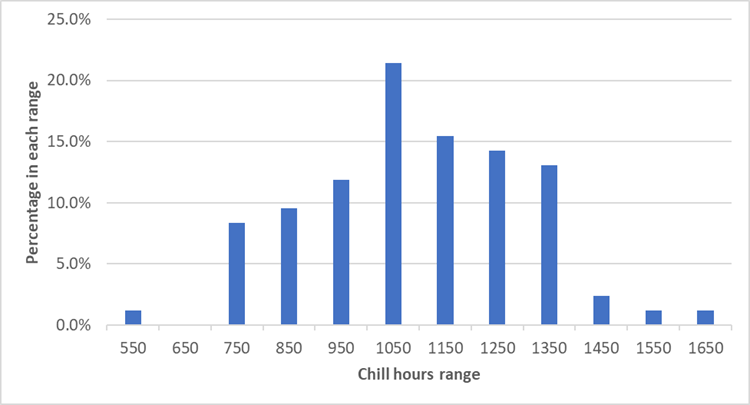
Fig. 2 Percentage of past years with received chill hours. The 550, 650, …, and 1650 in the chill hours range axis were set as ranges of “<=550”, “550-650”, …, and “1550-1650”, respectively, with only up boundaries inclusive.
The total peach yields declined but farm values increased steadily in GA (Fig. 3). The trends appeared to accelerate in recent decades and fluctuate far more unpredictably. Spring frost, chill inadequacy, and high temperatures during bloom and fruit set might be main climatic factors contributing to the fluctuation. The historical data is helpful for understanding future chill hours, peach production, and cultivar needs in the southeastern region.
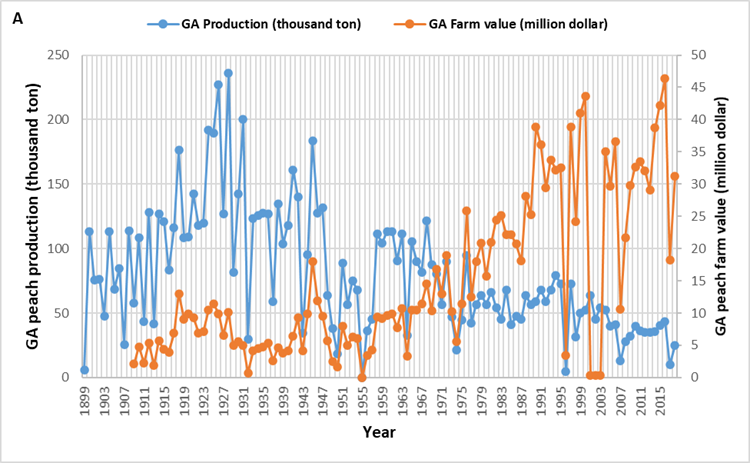
Fig. 3 Fluctuation of peach total yields and farm values in GA.