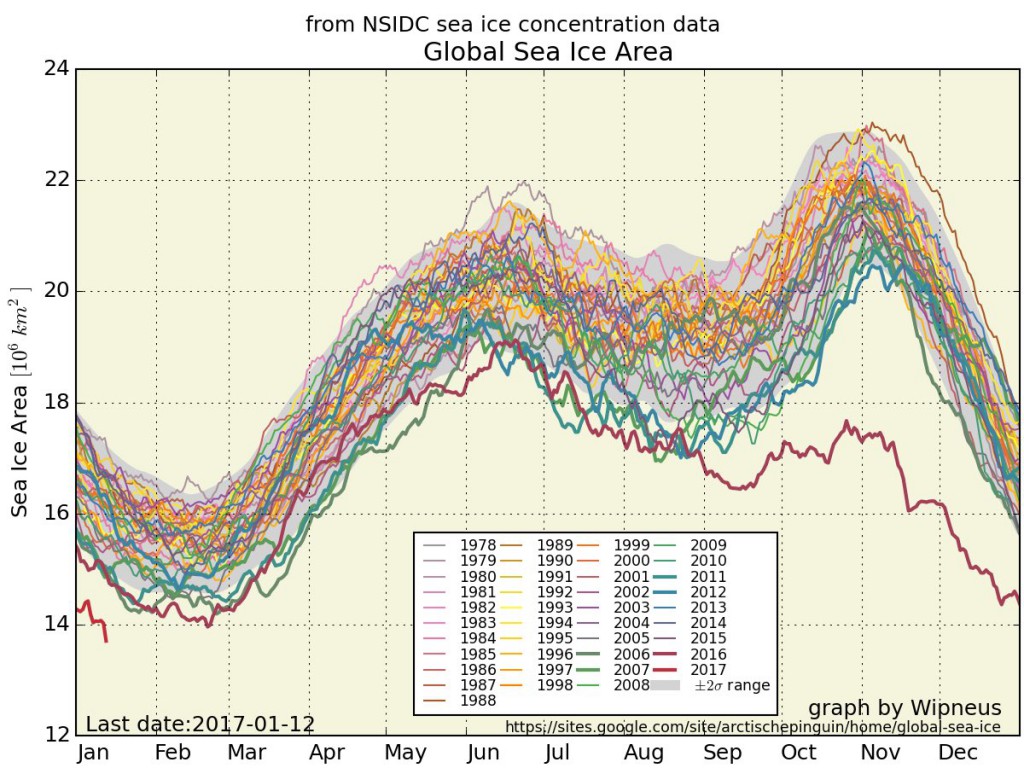
In previous blog posts I have noted the unprecedented decay of sea ice over the last few years and showed a graph which indicated a rapid decline of global (combined Arctic and Antarctic) sea ice this year. Here’s an update of the chart (most recent year in red). Note that the trend towards unbelievably low sea ice amounts compared to recent years has continued. This relates to the blog post from yesterday on how changes in the Arctic, particularly extremely warm temperatures linked to lack of sea ice cover in the Arctic, are changing the weather in the continental US. This year we’ve reached a new record low a month before the average minimum in sea ice. Where will it go from here? And how will it affect our weather going forward? Stay tuned.