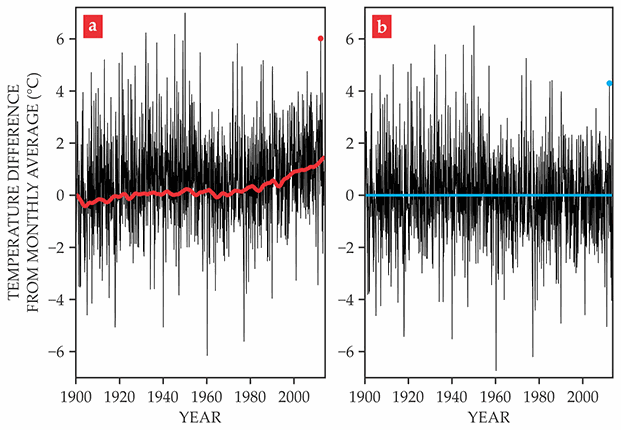
I was going through mail today and found this interesting commentary on interpreting climate records in Physics Today. The article discusses how different writers can take the same climate information (in this case, the very warm March 2012 temperature record from Durham NC) and write very different headlines based on how they interpret the data. All of the interpretations are correct but sound very different in how they address global warming. You can read this short article at https://scitation.aip.org/content/aip/magazine/physicstoday/article/69/10/10.1063/PT.3.3310. It’s probably a little more math heavy than most of the articles I post here but should not be a problem for most people.