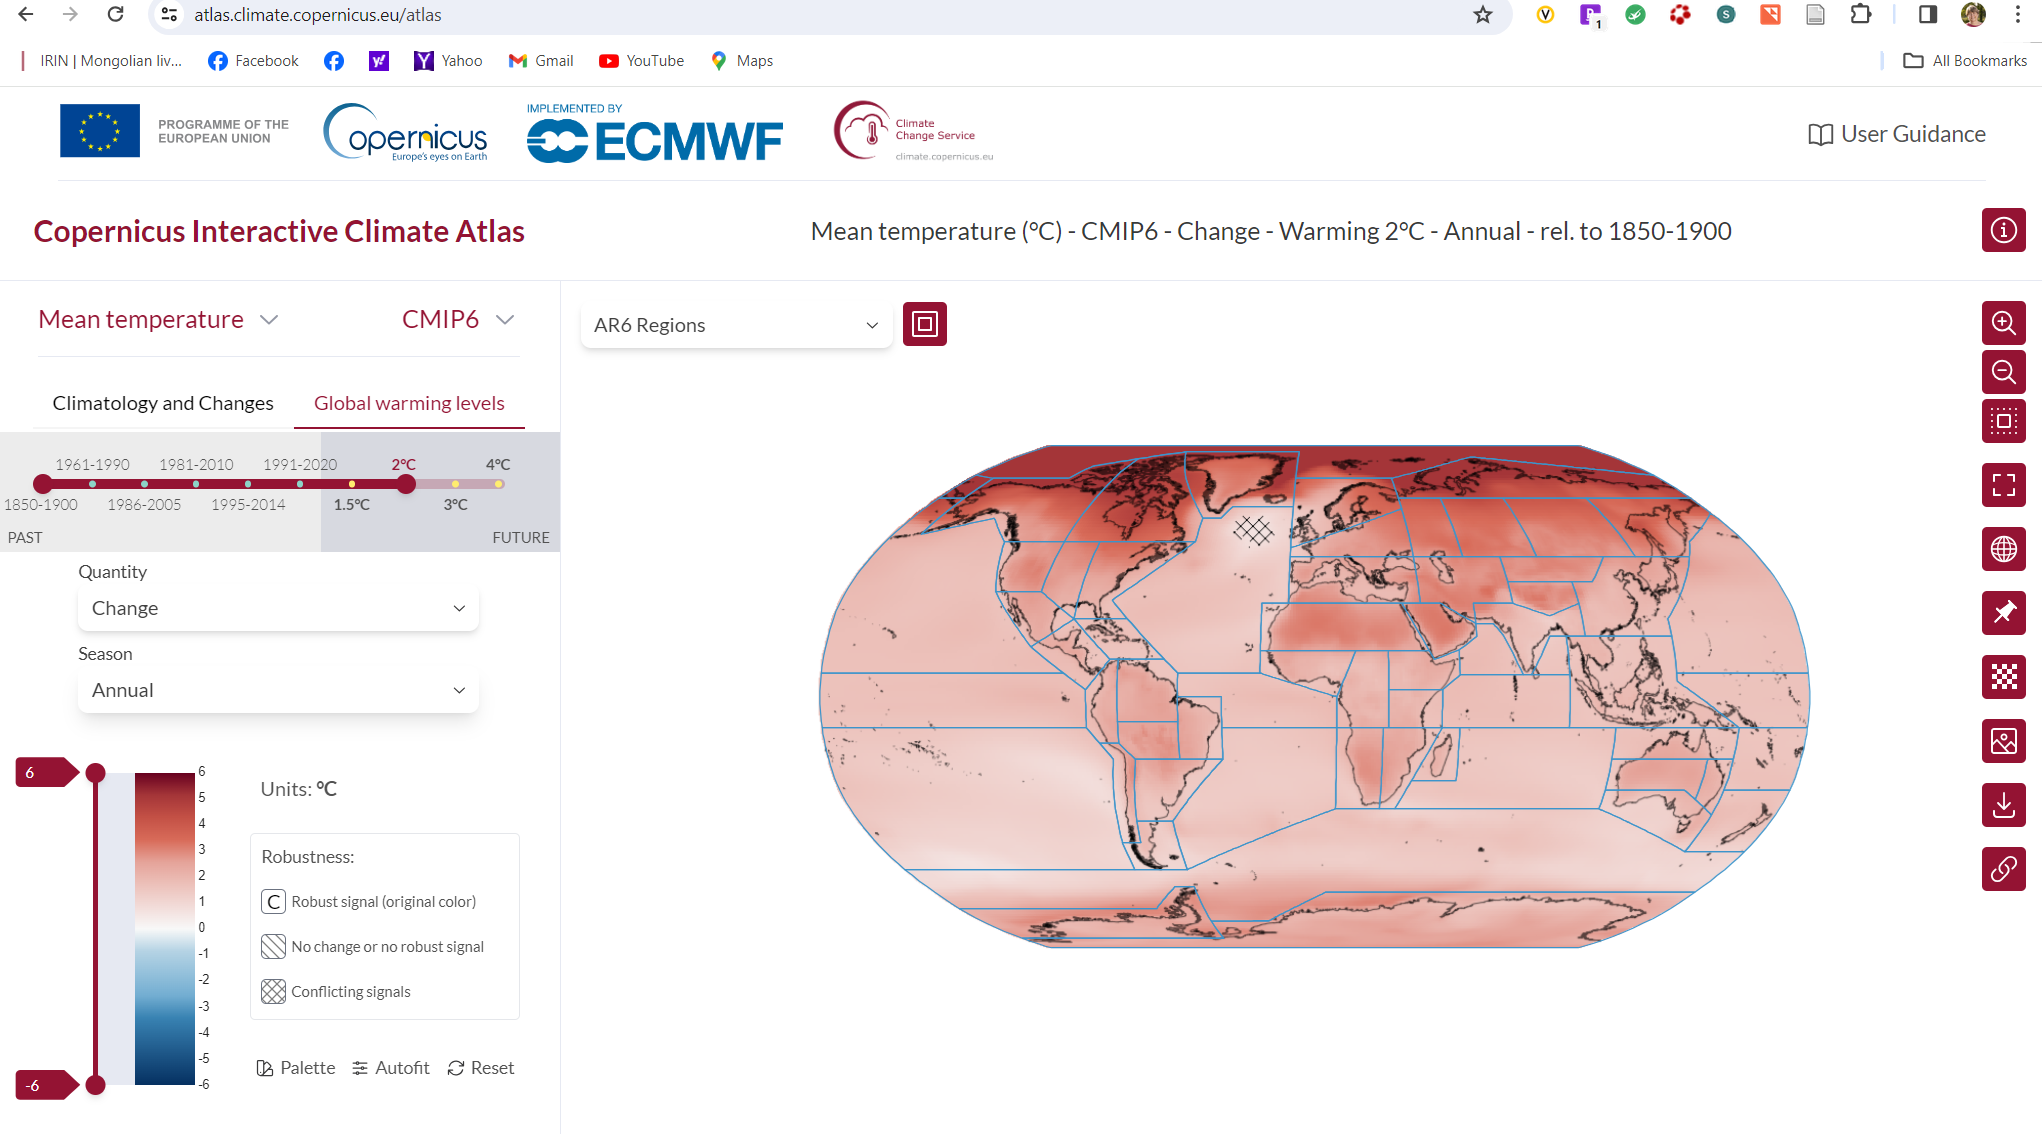
The Copernicus Interactive Climate Atlas, launched by the Copernicus Climate Change Service (C3S*) on 20 February, is set to be an important new resource for policymakers looking to formulate effective climate policy and for other users needing to visualise and analyse climate change information. This new tool from C3S, which builds on the Interactive Atlas of the Intergovernmental Panel on Climate Change (IPCC-IA), provides authoritative information on recent past trends and projected future changes for a wide range of key climate variables. I took a quick look at it and found that it provided a lot of regional and global information on climate change over time based on a variety of different data sources, but would be harder to use for local areas. You can read more about it at https://climate.copernicus.eu/copernicus-interactive-climate-atlas-game-changer-policymakers or go right to the atlas at https://atlas.climate.copernicus.eu/atlas.